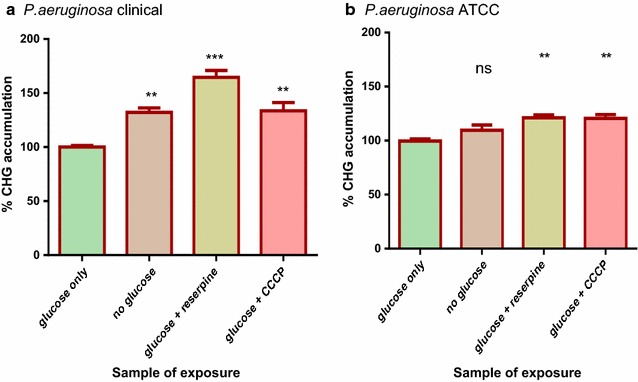
Fig. 3.

CHG accumulation assays for the clinical (a) and ATCC (b) strains of P. aeruginosa. Cells exposed to glucose served as the positive control where 100% accumulation occurred. The % CHG accumulation for rest of the sample treatments was in comparison to the positive control. The error bars show the standard deviation from the mean of two samples read twice. The difference between the control and other sample treatments was tested at 95% confidence interval. The asterisks indicate a significant difference from the control with **p < 0.01, ***p < 0.001 and ns shows no significant difference from the control
