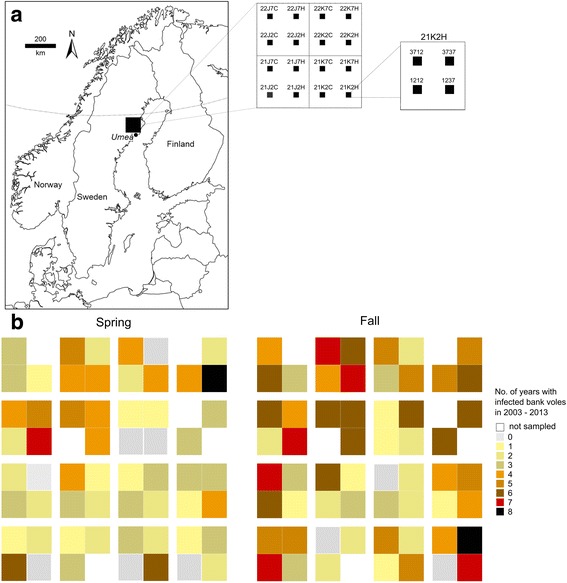
Fig. 1.

The study area in northern Sweden (black square) near the city of Umeå (a); the curved line indicates 65°N. The blow-up shows the 5 × 5 km landscapes, containing four 1-ha trapping plots each, totalling 58 trappable out of 64 plots (six plots encompassed for example water bodies and were not sampled). b) Each tile in the spring and fall panels represents a 1-ha plot and the colour coding reflects the number of years when infected bank voles were trapped, in spring and fall, between fall 2003–2013
