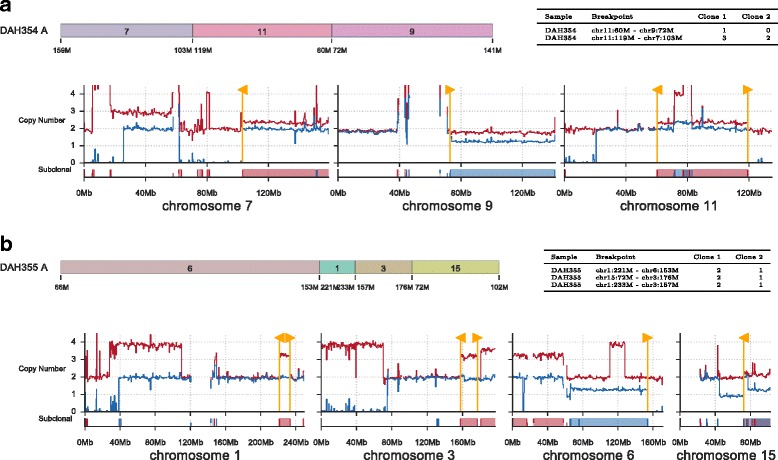
Fig. 6.

Inference of partial tumour chromosome assemblies based on linking subclonal segments and breakpoints. Two assembled chromosomes are shown for cell lines DAH354 (a) and DAH355 (b). Shown for each assembled chromosome is a schematic of the segments involved (top left), a table of breakpoint copy number predicted by ReMixT (top right), and a chromosome copy number plot (bottom). Each copy number plot shows raw major (red) and minor (blue) copy numbers (top axis), in addition to prediction of subclonality (bottom axis)
