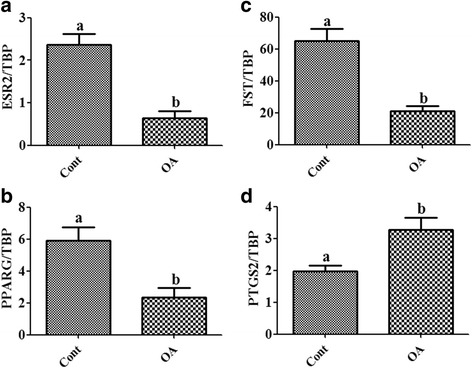
Fig. 2.

Effect of oleic acid on the expression of FOXL2 regulated genes. (a, b, c and d) OA induced regulation of ESR2, PPARG, FST and PTGS2 transcript abundance levels. Different letters indicate significant differences between treatment groups (mean transcript abundance relative to TBP ± standard error; different letters indicate significantly different means if P < 0.05, unpaired t-test from three independent experiments). Cont denotes vehicle control and OA denotes oleic acid treatment
