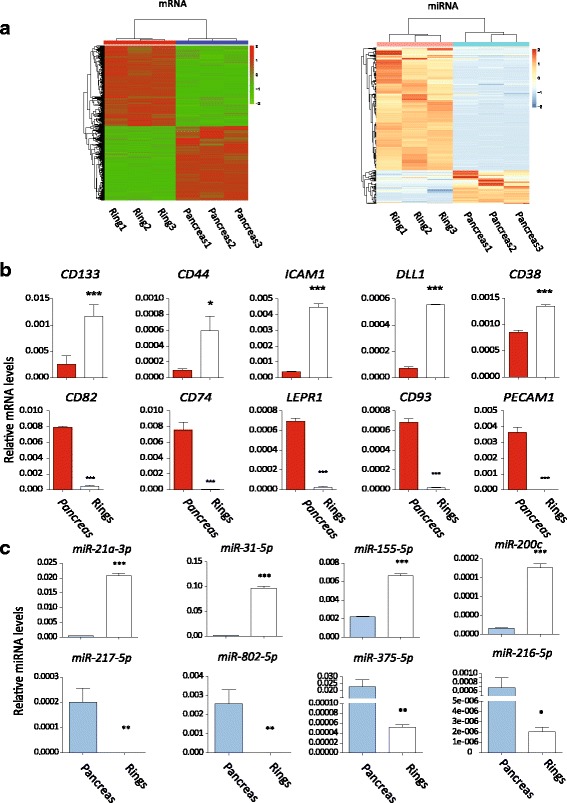
Fig. 4.

Differentially expressed mRNAs and miRNAs detected by HTS and verified by real-time PCR. a Heat map of all mRNAs and miNRAs showing differences in the transcriptome of the colonies and control. Three independent samples of colonies and their preculture controls (pancreas) were harvested for HTS. b, c Verification of differentially expressed mRNAs and miRNAs by real-time PCR. *p < 0.05, **p < 0.01 and ***p < 0.005, comparison to the control group. CD133, CD44, ICAM1, DLL1 and CD38 were enriched in ring colonies. miR-21a-3p, miR-31-5p, miR-155-5p and miR-200c were upregulated while miR-217-5p, miR-802-5p, miR-375-5p and miR-216-5p were downregulated (Color figure online)
