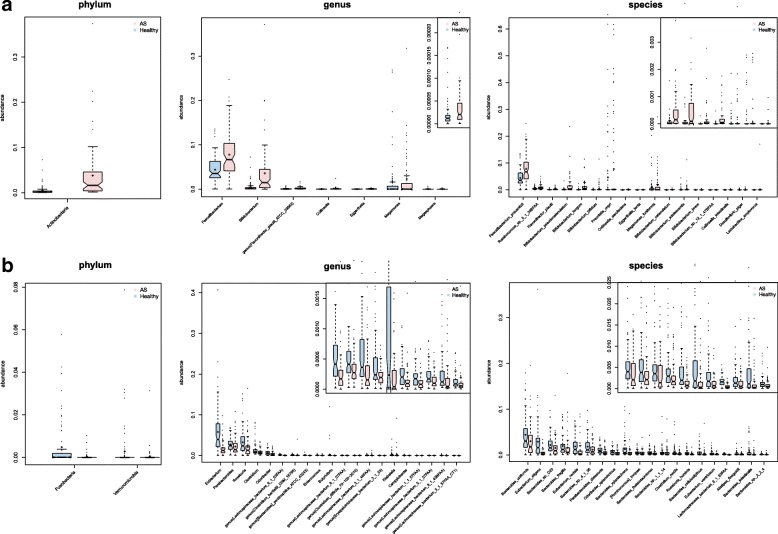
Fig. 1.
Differences of phylogenetic abundance between AS patients and healthy controls. The phylotypes that were increased (a) or decreased (b) in the AS patients at the phylum, genus, and species levels. Red and blue indicate the AS patients and healthy controls, respectively. The phylogenetic abundance of phyla that had mean values less than 1% and that of genera and species that were less than 0.01% were excluded. After exclusion, Wilcoxon rank-sum tests were applied to identify the differentially abundant phyla, genera, and species. Among these, the highest medians of the phylogenetic abundance in the enriched cohort were drawn as boxplots

