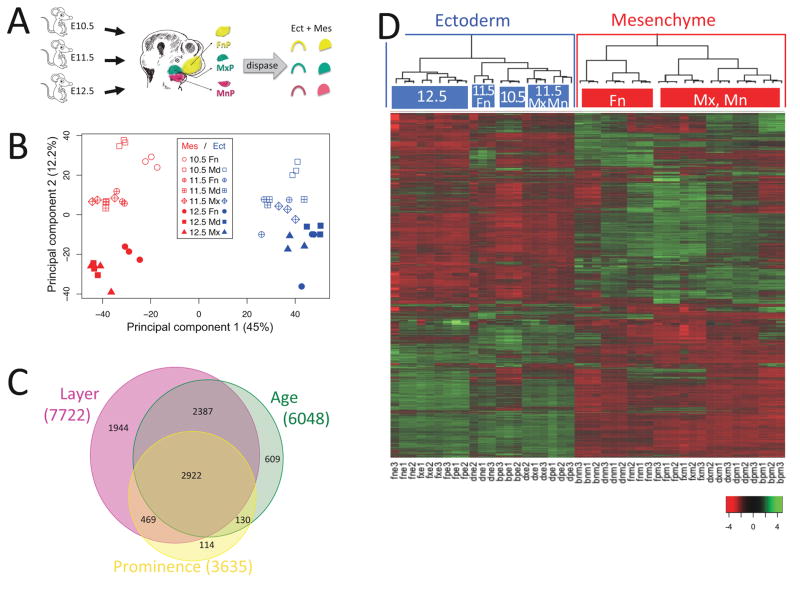
Figure 1.
Ectoderm-mesenchyme differences dominate the developing mouse face. A. Experimental design. Ectoderm and mesenchyme were separated by dispase treatment of microdissected facial prominences from ages E10.5, E11.5 and E12.5. Affymetrix MoGene-1.0-st-v1 microarrays were probed with random primed RNA from triplicate tissue samples. B. Principal Component Analysis of facial gene expression. The first component separated samples by tissue layer (ectoderm versus mesenchyme) and accounted for 44.95% of the variation between samples. The second component separated by age and accounted for 12.22% of the variation. The third component, accounting for 8.52% of the variation, did not separate by prominence. C. Differentially expressed genes. 9457 probesets in 8575 genes showed differential expression with p-value < 0.01 after multiple testing correction (Benjamini and Hochberg, 1995) by three-way Analysis of Variance (ANOVA). 90% (7722 genes) varied between ectoderm and mesenchyme, 71% (6048 genes) varied by age, 42% (3635 genes) varied by prominence, and 34% (2922 genes) varied by all three. D. Ectoderm and mesenchyme gene expression programs. Heatmap of differentially expressed genes after scaling (mean = 0 and standard deviation = 1, color key at lower right) and agglomerative hierarchical clustering using average distance and Pearson correlation coefficient. The array dendrogram (top) shows two major divisions (highlighted with blue and red boxes) corresponding to the ectodermal and mesenchymal tissues. Statistically significant sub-groups (p > 99%) are indicated with colored top-bars, and labeled according to their unifying characteristics. The bootstrap probabilities used to derive statistical significance are described in Materials and Methods. Sample labels: b, E10.5; d, E11.5; f, E12.5; n, FnP; p, MdP; x, MxP; e, Ect; m, Mes; number refers to which biological replicate.

