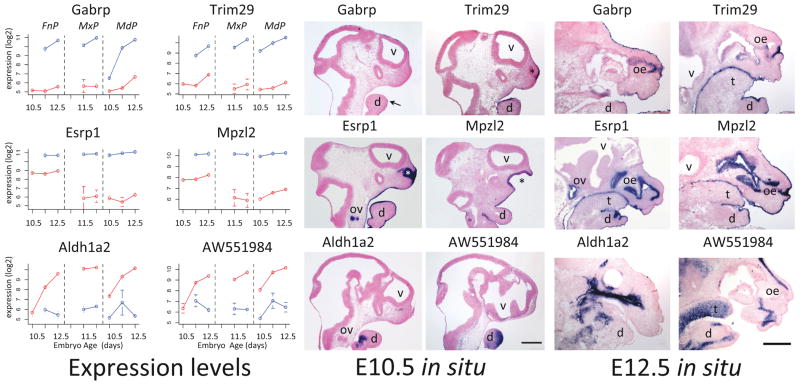
Figure 2.
Validation by in situ hybridization. Left Panel: Mean microarray expression levels in ectoderm (blue) and mesenchyme (red) with error bars indicating standard deviation for four genes with ectoderm-specific expression (Gabrp, Trim29, Esrp1, Mpzl2) and two with mesenchyme-specific expression (Aldh1a2, AW551984). Center Panel: E10.5 in situ hybridization to sagittal sections of the head. Right Panel: E12.5 in situ hybridization to sagittal sections of the face, with mandible (d), tongue (t), olfactory epithelium (oe), otic vesicle (ov) and ventricles (v). Asterisk (*) indicates the nasal pit and the arrow patchy expression of Gabrp in the E10.5 mandible. Ventral is right, rostral is up. Scale bars, 500 microns.

