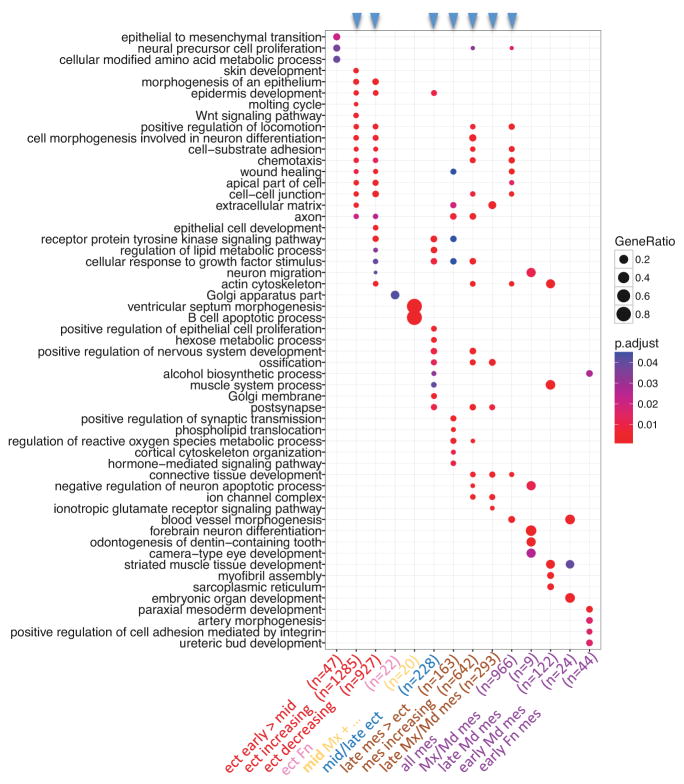
Figure 8.
PMC module-associated functions. Each of the 14 PMC modules, which were defined by enrichment of genes associated with OFCs (p < 0.05), was tested for enrichment of GO-BP terms and GO-CC terms. The top GO terms from each module (ranked by statistical significance) were then used to compare functions across all PMC modules. Modules are plotted against GO terms with the dot color indicating statistical significance for enrichment, and the dot size indicating fraction of module genes associated with that term. Module order is the same as in Figure 7, with the color of the module label indicating its spatio-temporal expression cohort (from Figure 7), the text label describing its expression characteristics and n indicating the number of genes in the module. The blue arrowheads at the top indicate the larger modules, each of which were enriched for many functional annotations - likely reflecting several functional groups within each of these modules.

