
Figure 2.
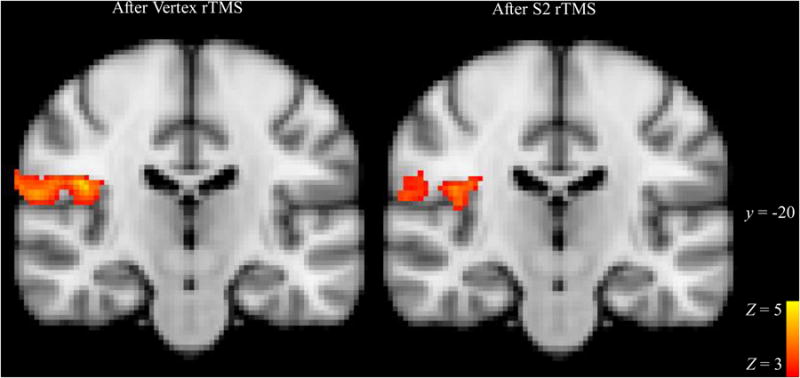
BOLD response to slow brushing stimulus in S2 after rTMS to S2 or Vertex. Significant clusters of BOLD activations to brushing > rest after Vertex rTMS (control; left panel) and S2 rTMS (right panel) are displayed at a representative slice through S2 cortex, y = 20. Clusters are displayed above a statistical threshold of Z > 3, whole-brain corrected for multiple comparisons (p < 0.001). x and y indicate MNI coordinates. The images are shown in radiological convention.