
Figure 3.
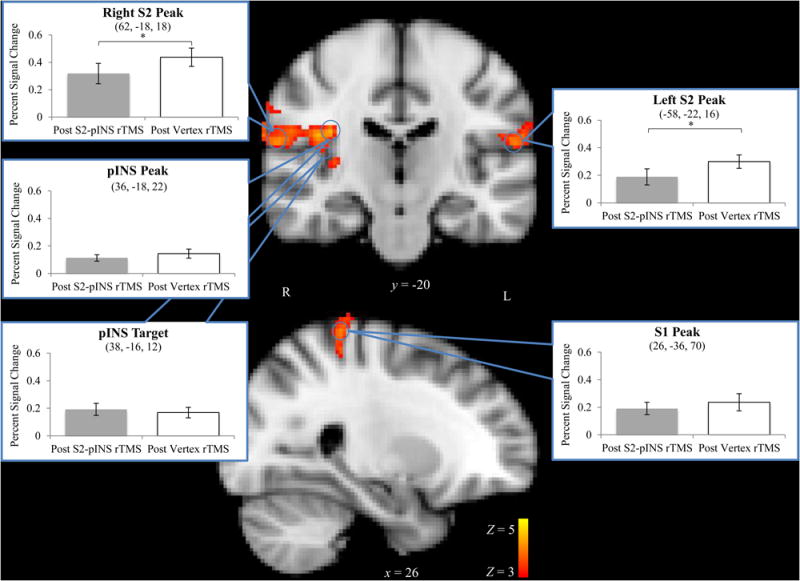
Brushing-evoked BOLD response averaged across rTMS sessions with ROI analyses superimposed. Clusters are displayed above a statistical threshold of Z > 3, whole-brain corrected for multiple comparisons (p < 0.01). 5 mm spheres were drawn around peak brushing activations (blue circles). Only right and left S2 ROIs showed a significantly different mean BOLD response to brushing after rTMS to S2 (grey bars, left) versus rTMS to the vertex (white bars, right). x and y indicate MNI coordinates. The right side of the images correspond to the left side of the brain, * = one-tailed p < 0.05. Error bars ± SEM.