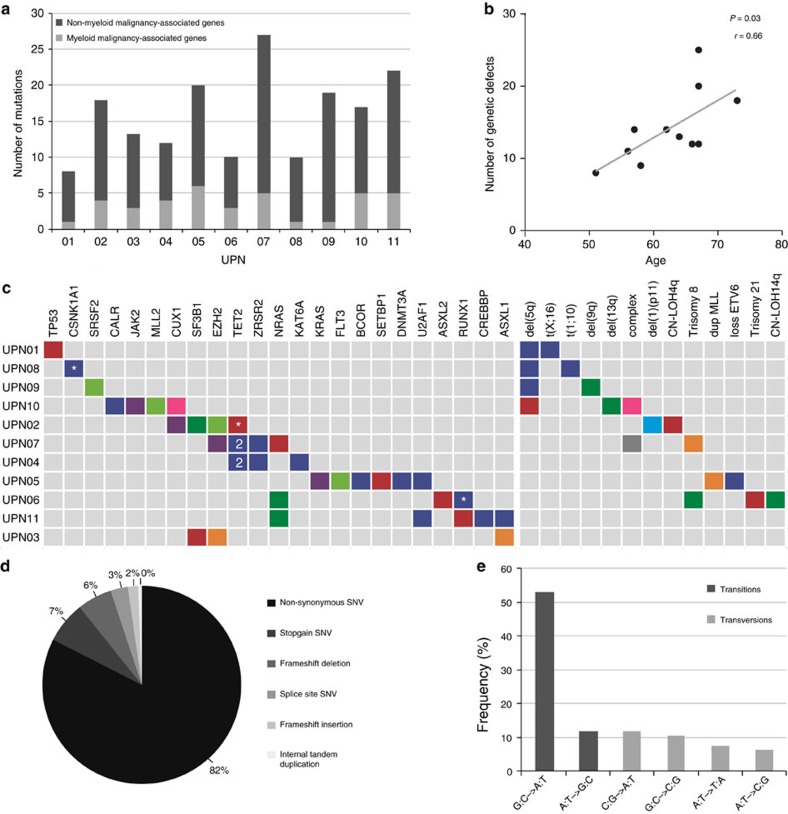
Figure 1. Genetic defects in 11 MDS patients.
(a) Number of acquired mutations in 11 patients with MDS, as determined by whole-exome sequencing at several time points (Supplementary Data 1) and confirmed by amplicon-based deep sequencing. In light grey, the number of mutations in genes previously implicated in the pathogenesis of myeloid malignancies are indicated (driver mutations)2,3,25,41,42,43,44, and in dark grey the number of mutations not previously implicated in myeloid malignancies (putative passenger mutations). (b) A positive correlation could be observed between age and the number of genetic defects (genetic and cytogenetic defects) at the time of first sampling. Pearson’s correlation coefficient (including a two-tailed P value calculated by Student’s t-test) was determined. (c) For each patient, all mutations in genes known to be recurrently mutated in myeloid malignancies are depicted as well as all cytogenetic defects detected by high-resolution SNP array and/or karyotype analysis. The colours match with the (sub)clones as depicted in Figs 2 and 3. *Indicates a mutated gene that is also affected by a copy number gain or loss or by a copy-neutral loss of heterozygosity (CN-LOH); ‘2’ indicates two different mutations affecting the same gene. (d) Distribution of the different types of alterations detected in the total set of patients. (e) Different types of single-nucleotide changes detected in all patients, with transitions in dark grey and transversions in light grey.

