Figure 4.

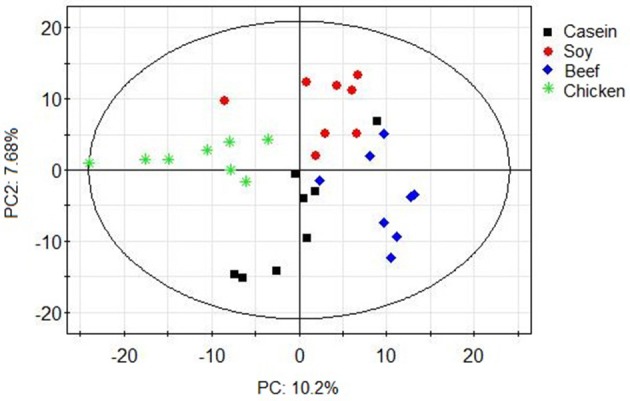
PCA scores plot of gut microbiota of rats in response to different dietary proteins. Each point represents one biological sample.

PCA scores plot of gut microbiota of rats in response to different dietary proteins. Each point represents one biological sample.