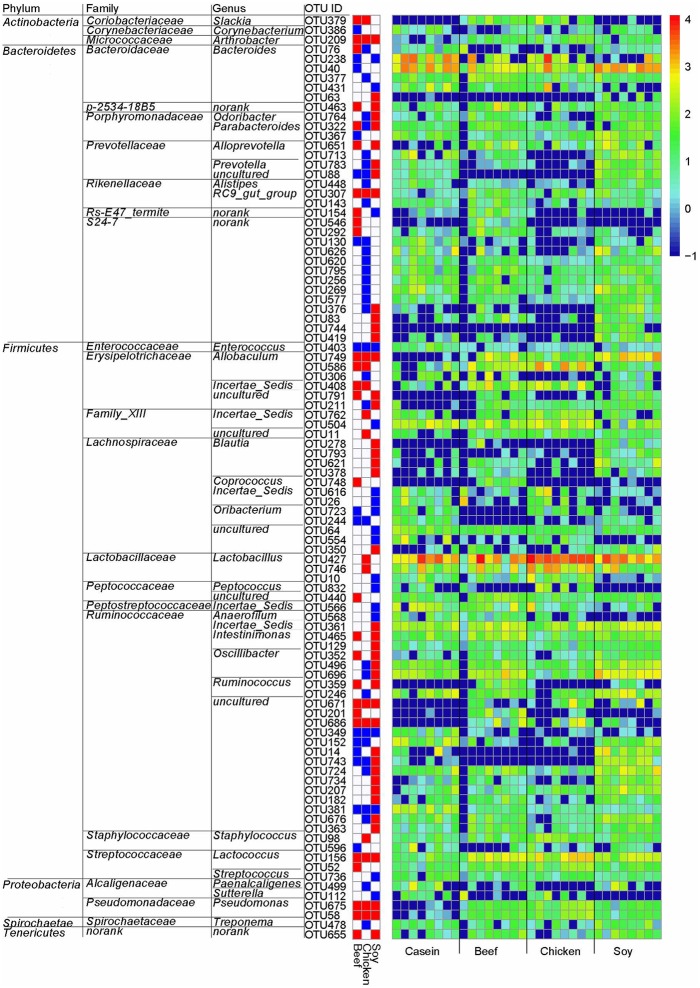
Figure 6.
Gut bacteria at the OTU level in response to dietary proteins using LefSe. (1) The left part lists significant difference of OTU and corresponding phyla, families and genera; (2) The middle heatmap shows rich group and poor group of each OTU; (3) The right heatmap shows the relative abundance of OTU (log 10 transformed). Each column represents one biological sample and each row represents one OTU.

