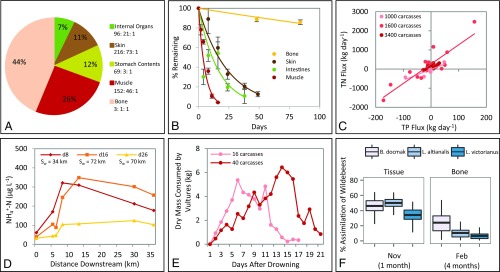
Fig. 2.
Input and fate of wildebeest carcasses from mass drownings in the Mara River. (A) Percentage of dry mass composition of an average wildebeest carcass, with stoichiometric ratios by mass shown as C/N/P. (B) Microbial decomposition rates for wildebeest bone, skin, intestines, and muscle in the Mara River (mean ± SEM). (C) Daily estimations of total nitrogen (TN) vs. total phosphorus (TP) flux downstream of three carcass aggregations ranging from 1,000–3,400 carcasses. (D) Declines in NH4+-N concentration downstream of wildebeest carcasses and estimations of nutrient uptake length (Sw) on days 8, 16, and 26 after the drowning. (E) Total dry mass of wildebeest carcasses consumed by avian scavengers on aggregations of 16 and 40 carcasses. (F) Assimilation of wildebeest tissue (in November 2013, 1 mo after carcasses were present) and bone biofilm (in February 2014, 4 mo after carcasses were present) by three common fish taxa (mean ± 95% credibility intervals).

