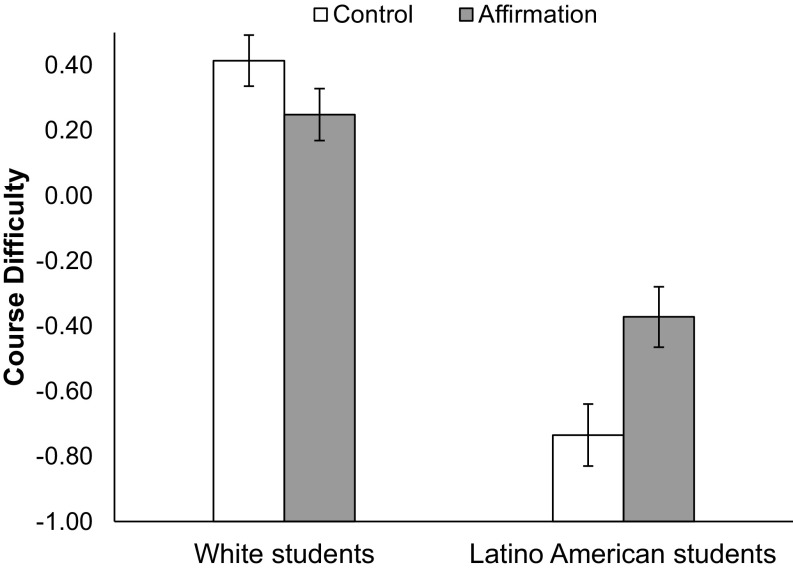
Fig. 2.
Outcomes corresponding to the college readiness track for students in study 1, as a function of ethnicity and condition, adjusted for preintervention academic performance and sex. The y-axis represents adjusted course difficulty for all three cohorts in study 1, 2 y after the intervention, standardized within grade level (n = 160). Adjusted means were obtained from linear regression. Error bars represent ±1 SE. See SI Appendix for analogous figures for enrollment in remedial clinics, AVID, and the mainstream high school, as well as raw means for each outcome.

