Fig. 1.
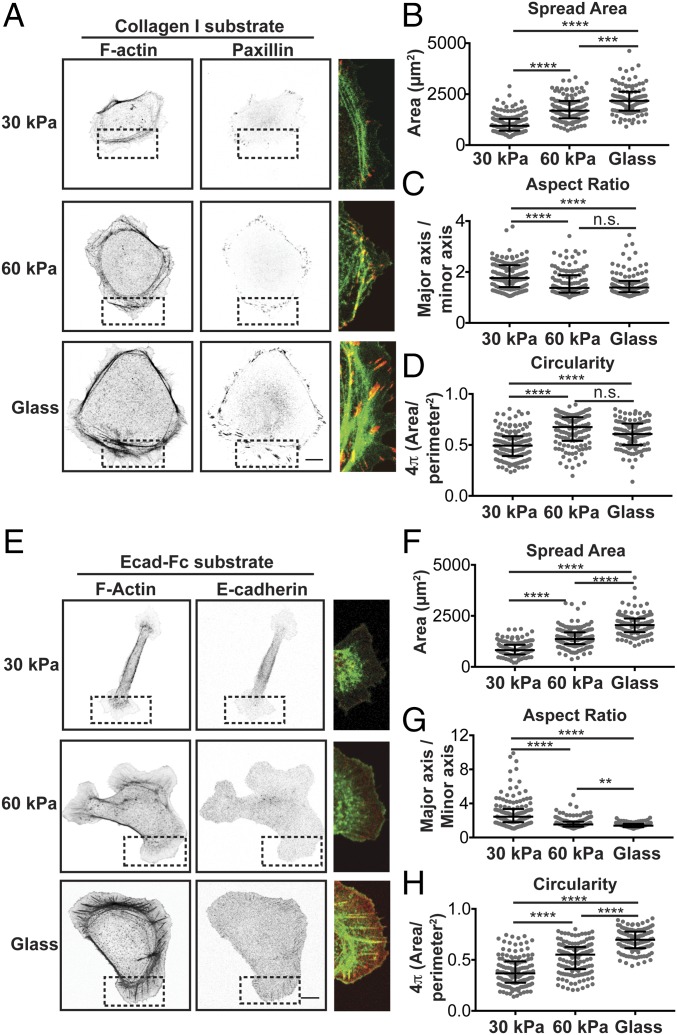
Effects of integrin– and E-cadherin–based rigidity sensing on adhesion organization and cell morphology. (A) Confocal images of MDCK cells fixed and stained for F-actin (phalloidin) (Left) and paxillin (Center) on collagen-I–coated substrates of different moduli. (A, Right) The dotted box in each image is merged and expanded (F-actin, green; paxillin, red). (Scale bar, 10 µm.) (B–D) Quantification of morphological features, including cell spread area (B), aspect ratio (C), and circularity (D). Cumulative data from three experiments are represented in a dot plot, where each dot represents one cell. The solid black line indicates the median and the upper and lower bars represented the interquartile range (n > 140 cells per condition). (E) Confocal images of MDCK cells stably expressing E-cadherin:dsRed fixed and stained for F-actin (phalloidin) on Ecad-Fc–functionalized substrates of different moduli. (E, Right) Dotted box in each image is merged and expanded (F-actin, green; E-cadherin:dsRed, red). (Scale bar, 10 µm.) (F–H) Quantification of morphological features, including cell spread area (F), aspect ratio (G), and circularity (H). Cumulative data from three independent experiments are represented in a dot plot, where each dot represents one cell. The solid black line indicates the median and upper and lower bars represent the interquartile range (n > 115 cells per condition). Statistics were determined using a Kruskal–Wallis test with Dunn’s posttest for multiple comparisons, **P < 0.001, ***P < 0.0002, ****P < 0.0001. Noncumulative averages and statistics for the three independent experiments presented in B–D and F–H are listed in Table S2.

