Fig. 3.
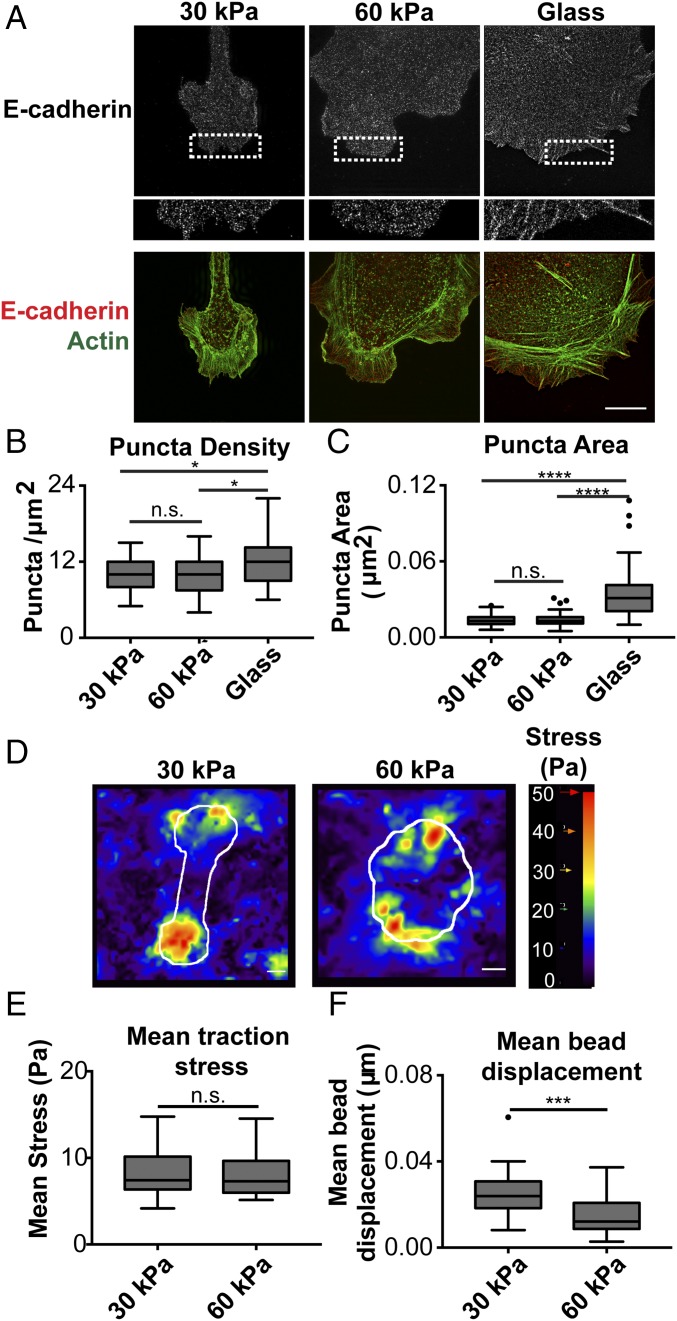
Cells adhered to 30-kPa and 60-kPa Ecad-Fc PA gels exhibit similar cadherin clustering and mean traction stress, but the distribution of stress and strain differs. (A) Representative SIM images of cells stably expressing E-cadherin:dsRed and stained for actin (phalloidin). (A, Lower) Dotted box in the E-cadherin image is expanded. (Scale bar, 10 µm.) (B) Quantification of E-cadherin puncta per square micrometer represented in a box and whisker format, in which the ends of the box mark the upper and lower quartiles, the horizontal line in the box represents the median, and whiskers outside the box extend to the highest and lowest value within the 1.5× interquartile range. Data shown are cumulative from three independent experiments. (C) Quantification of E-cadherin puncta size represented in a box and whisker format. Data shown are cumulative from three independent experiments. For quantification (B and C), five 1-µm2 regions within cell protrusions were analyzed per cell and at least 10 cells per condition were quantified. Statistics were determined using a Kruskal–Wallis test with Dunn’s posttest for multiple comparisons, *P < 0.05, ****P < 0.0001. (D) Heat maps of the traction stress (magnitude shown) produced by cells adhered to Ecad-Fc PA gels, with cell boundary as overlay in white. (Scale bar, 10 µm.) (E) Mean traction stress (measured within cell boundaries) produced by cells on 30-kPa and 60-kPa Ecad-Fc PA gels. Results are represented in box and whisker format. n = 27 cells (30 kPa) and 19 cells (60 kPa). Statistics were determined using a Mann–Whitney test. (F) Mean bead displacements within 30-kPa and 60-kPa Ecad-Fc PA gels resulting from cell tractions. n = 27 (30 kPa) and 19 (60 kPa). Statistics were determined using a Mann–Whitney test. ***P = 0.0005.

