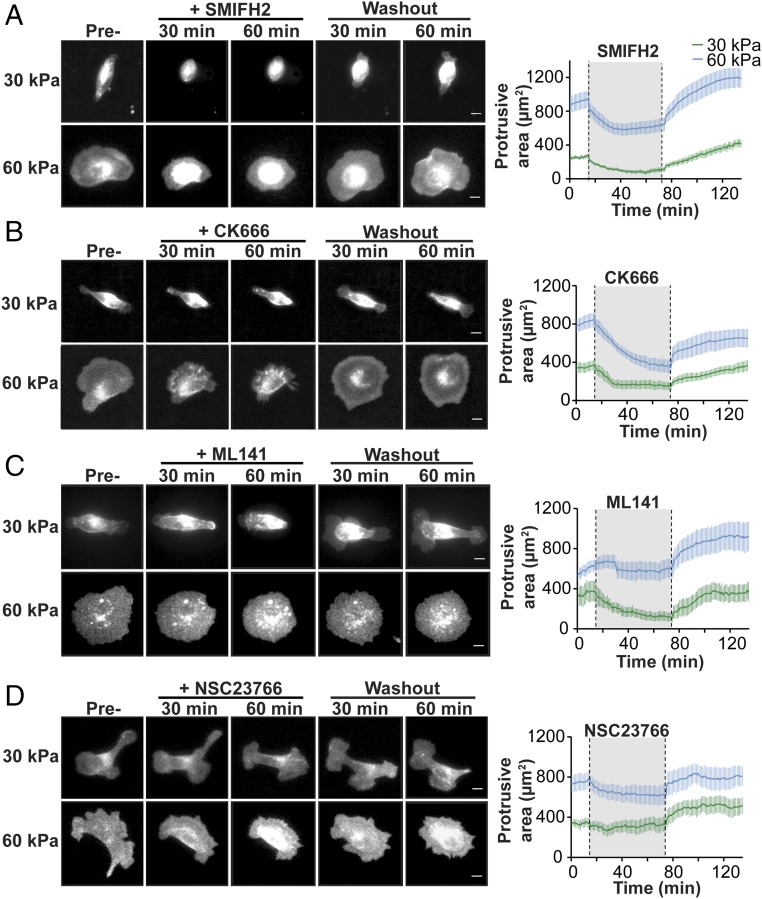
Fig. 4.
Cell adhesion to a 30-kPa and 60-kPa Ecad-Fc PA gel requires the activities of distinct signaling molecules. (A–D) Representative montage of MDCK cells stably expressing E-cadherin:dsRed adhered to a 30-kPa or 60-kPa Ecad-Fc PA gel. Each panel is representative of the effects on cell protrusive area following the addition and washout of different inhibitors: (A) pan-formin inhibitor, SMIFH2; (B) Arp2/3 inhibitor, CK666; (C) Cdc42 inhibitor, ML141; and (D) Rac inhibitor, NSC23766. (Scale bar, 10 µm.) (A–D, Right) Line graphs represent the mean protrusive area for each condition throughout the time course of the experiment. For each line graph, the mean protrusive area of cells on a 30-kPa Ecad-Fc PA gel and on a 60-kPa Ecad-Fc PA gel is indicated by the green and blue lines, respectively. The gray region between the dotted lines indicates the period in which the inhibitor was present. n ≥ 10 cells per condition from at least three independent experiments; error bars represent SEM.

