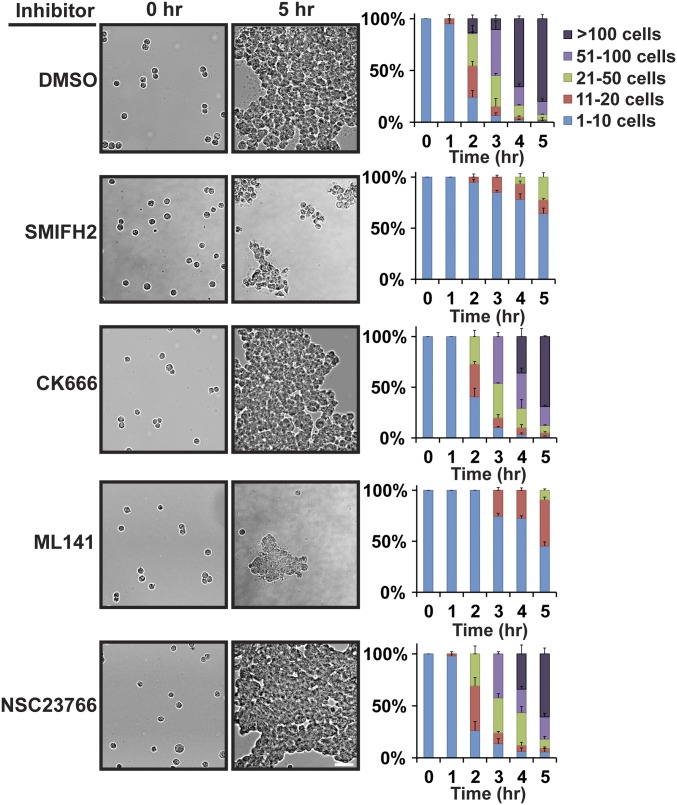
Fig. 5.
Formin or Cdc42 inhibition disrupts cell–cell adhesion in a 3D hanging-drop assay. (Left) Bright-field images showing aggregation of MDCK cells at 0-h and 5-h time points in the presence of the indicated inhibitors. (Scale bar, 50 µm.) (Right) Quantification of hanging-drop assays in the presence of the indicated inhibitors. Cells were binned into cluster classes: 1–10 cells, 11–20 cells, 21–50 cells, 51–100 cells, or >100 cells. The percentage of cells in each cluster size for each time point is indicated. The data shown are averaged from three independent experiments and errors bars represent SEM.

