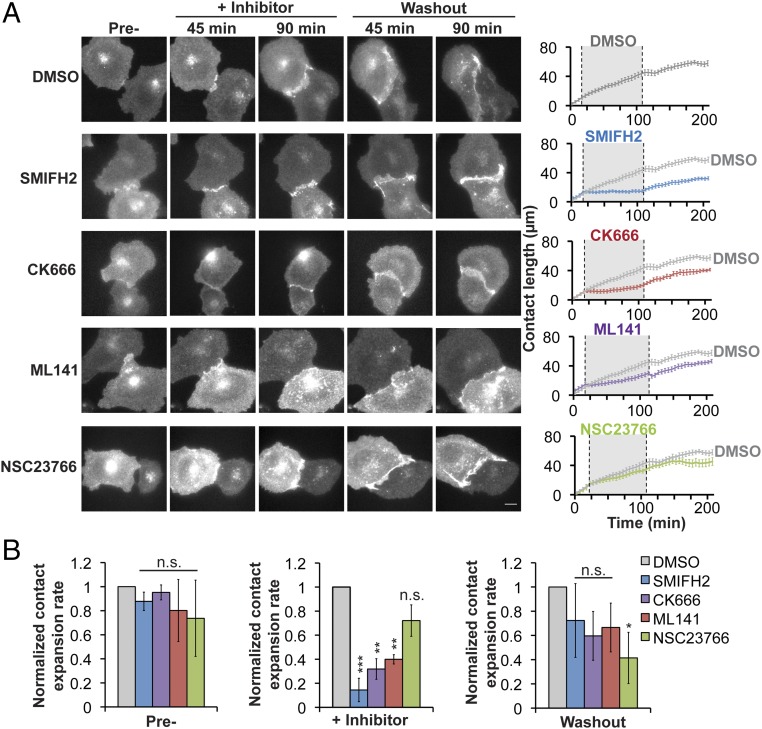
Fig. 6.
Disruption of cell–cell contact expansion between pairs of MDCK cells, using small molecule inhibitors. (A, Left) Images of pairs of MDCK cells stably expressing E-cadherin:dsRed during the formation and expansion of cell–cell contacts. (Scale bar, 10 µm.) (A, Right) Quantification of cell–cell contact length over time. The solid line is representative of the mean contact length for each condition; the DMSO control line is copied in each of the graphs of the inhibitors as a reference. The gray region indicates the period during which the inhibitor was present (n ≥ 10 contacts per condition from at least three independent experiments; error bars indicate SEM). (B) Bar graphs for the expansion rate for cell–cell adhesion for each condition during pretreatment, addition of the inhibitor, and washout period, normalized to the rate in the DMSO control for each time point (value of 1). Statistics were performed using a Student’s t test. *P < 0.05, **P < 0.001, ***P < 0.0001.

