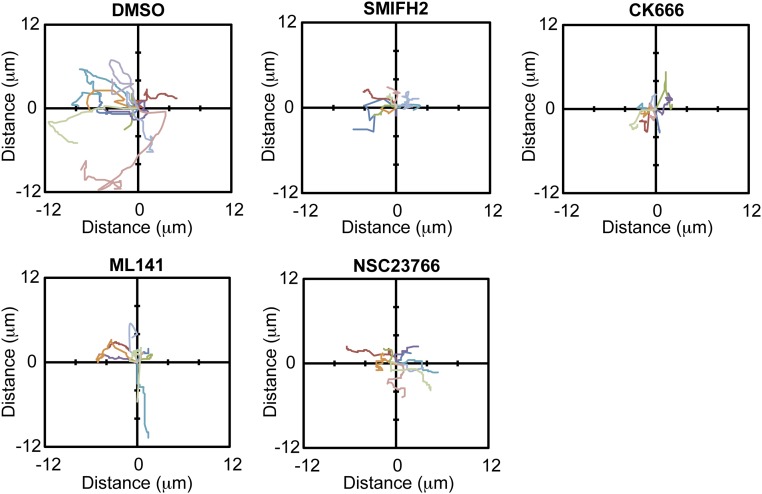
Fig. S9.
Center of mass motion during contact formation. Center of mass motion of MDCK cells forming contacts was tracked using FIJI and plotted in a smoothed-line scatter plot to display the trajectory for each condition. Each colored line represents a different cell. At least nine cells were tracked per condition.

