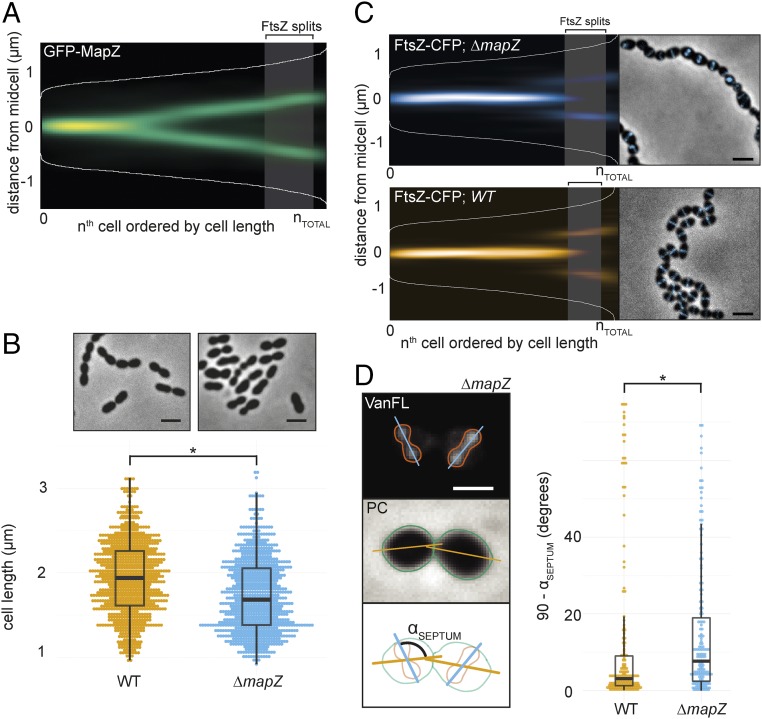
Fig. 1.
MapZ sets the pneumococcal division plane but is not involved in division site selection. (A) Fluorescence microscopy of 2,976 cells and 7,020 spot localizations were quantified and analyzed using Oufti and SpotprocessR (see Materials and Methods). The distance of GFP-MapZ (strain RR101) from midcell was plotted in a heatmap where all localizations are ordered by cell length, and the color saturation represents the density of the localizations. The shaded area represents the point in the cell cycle where 50% of the FtsZ proteins move to the 1/4 positions of the cell (124 ± 9.04% of the mean cell length; see Materials and Methods). (B) Cell size distribution of wild-type D39 and ΔmapZ cells (strain RR93), representing measurements of 1,692 and 705 cells, respectively. (Top) Phase contrast microscopy images. (Scale bar, 2 µm.) (C) The localization of FtsZ-CFP in wild-type (strain RR23) and ΔmapZ (strain RR105) cells as shown by histograms and micrographs from overlays of phase contrast images with CFP signal. (Scale bar, 2 µm.) The plots are based on data from 617 cells/957 localizations for ΔmapZ and 1,717 cells/2,328 localizations for wild type. The shaded area represents the point where 50% of FtsZ moves to the 1/4 positions in wild-type cells. (D) The angle of the septum relative to the length axis of the cells is larger and more variable in ΔmapZ cells. (Left) Wild-type D39 and ∆mapZ cells (strain RR93) were stained with Van-FL. Fluorescence image (Top), phase contrast image (Middle), and a schematic drawing of the analysis (Bottom) are shown. The angle, αSEPTUM, was measured automatically by measuring the angle between the long axis of the bounding boxes of the cell outlines and the long axis of the bounding box of the Van-FL signal. The angles of both wild-type and ΔmapZ cells are significantly different from 90° (sign test, P ≤ 2.2 × 10⁻¹⁶), however the septum angle is significantly more skewed in ΔmapZ cells (P < 0.05, Kolmogorov–Smirnov test). (Scale bar, 1 µm.) (Right) The αSEPTUM plotted in wild-type cells and ∆mapZ cells. A total of 177 and 181 cells were measured for wild type and ΔmapZ, respectively. The asterisks denote statistically significant differences.

