Fig. 3.
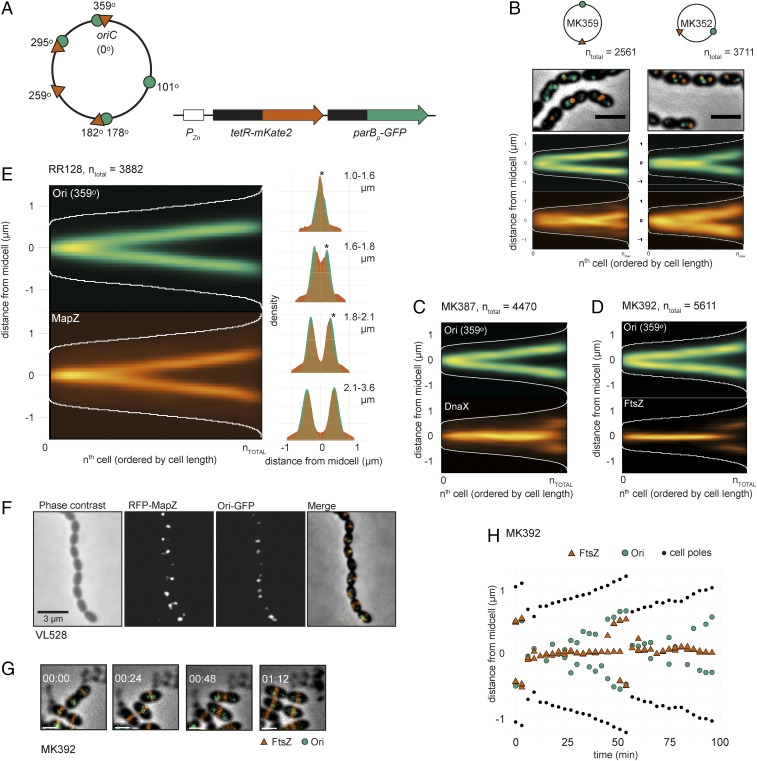
Chromosomal organization in S. pneumoniae. (A) Visualizing specific genetic loci in live cells by fluorescence microscopy was done by developing two independent chromosomal markers systems: TetR-mKate2/tetO (tetO integration sites indicated by red triangles on the chromosome map) and ParBp-GFP/parSp (parSp integration sites indicated by green circles). tetR-mKate2 and parBp-GFP are ectopically expressed from the nonessential bgaA locus under control of the Zn2+-inducible promoter PZn. (B) Localization of the origin and terminus (MK359, Left) and left and right arm (MK352, Right) in exponentially growing cells. Overlays of GFP signal, RFP (mKate2) signals, and phase contrast images are shown. (Scale bar, 2 µm.) The data represent 2,561 cells/3,815 GFP-localizations/2,793 RFP-localizations from MK359 and 3,711 cells/5,288 GFP-localizations/4,372 RFP-localizations from MK352. (C) Localization of the origin (ParBp-GFP/parSp at 359°) and DnaX-RFP (MK387). The data represent 4,470 cells/5,877 GFP-localizations/4,967 RFP-localizations. (D) Localization of the origin (ParBp-GFP/parSp at 359°) and FtsZ-RFP (MK392). The data represent a total of 5,611 cells/6,628 GFP-localizations/26,674 RFP-localizations. (E) Localization of the origin (ParBp-GFP/parSp at 359°) and RFP-MapZ (RR128) on the length axis of the cell shown as heatmaps (Left) and overlay of both localization density plots when the cells are grouped in four quartiles by cell length (Right). Stars indicate a significant difference between GFP and RFP localization (Kolmogorov–Smirnov test, P < 0.05). The data represent 3,882 cells/1,785 GFP-localizations/8,984 RFP localizations. (F) Microscopy images of strain VL528 showing subsequent origin and MapZ splitting. Phase contrast, RFP, GFP, and overlay images are shown. (Scale bar, 3 µm.) (G and H) Time-lapse microscopy shows that the origins move to the next cell halves before FtsZ. Snap shots from a representative time-lapse experiment (G) and plotting of the distances of FtsZ, the origins, and the cell poles relative to midcell in a single cell (H) are shown. (Scale bars in G and H, 1 μm.) More examples of origin and FtsZ localizations in single cells are shown in SI Appendix, Fig. S7.

