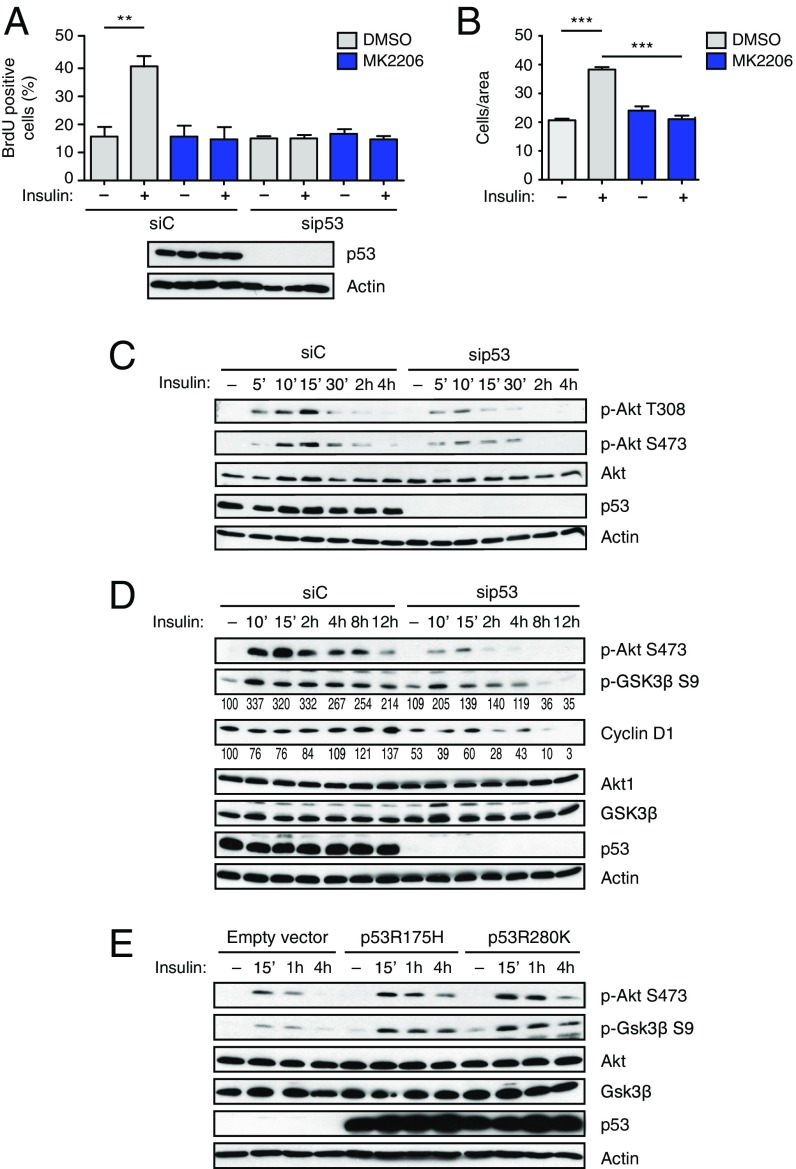
Fig. 2.
Mutant p53 increases insulin-induced proliferation and migration through AKT activation. (A and B) Insulin-induced cell proliferation and invasion require AKT activity. (A) MDA-MB231 cells were transfected with the indicated siRNAs for 48 h, serum-starved, and treated with insulin (0.5 μg/mL) for 24 h, with or without the specific AKT inhibitor MK2206 (5 μM). (B) Cells were serum-starved and treated with insulin (0.5 μg/mL) for 24 h, with or without the specific AKT inhibitor MK2206 (5 μM). Proliferation and invasion assays were performed as in Fig. 1 (A and B: mean ± SEM; n = 3; **P < 0.01, ***P < 0.001). (C) Depletion of mutp53 reduces insulin-induced AKT activation in cancer cells. MDA-MB231 cells were transfected with the indicated siRNAs for 48 h, serum-starved for 24 h, and treated with insulin (0.5 μg/mL) for the indicated times. Phosphorylated (p-T308 and p-S473) and total AKT1 were detected by immunoblotting. With actin as a loading control, p53 was blotted to control knockdown efficiency. p-AKT S473 is taken from a different gel, loaded in parallel with the same amount of lysate. (D) Depletion of mutp53 affects prolonged AKT-dependent responses to insulin. MDA-MB231 cells were treated as in C. Phosphorylated and total Akt1, GSK3β, and cyclin D1 were detected by immunoblotting as above. With actin as a loading control, p53 was blotted to control knockdown efficiency. Numbers indicate relative p-GSK3β/GSK3β and cyclin D1/actin ratios, quantified by densitometry on autoradiography film (also Fig. S3E). Total AKT is taken from a different gel, loaded in parallel with the same amount of lysate. (E) Mutant p53 enhances insulin-induced AKT activation. H1299 cells (p53-null) were infected with retroviruses encoding the indicated p53 mutants. Cells were treated with insulin (0.5 μg/mL) for the indicated times. Phosphorylated and total AKT1 and GSK3β were detected by immunoblotting as above. With actin as a loading control, p53 was blotted to verify expression levels.

