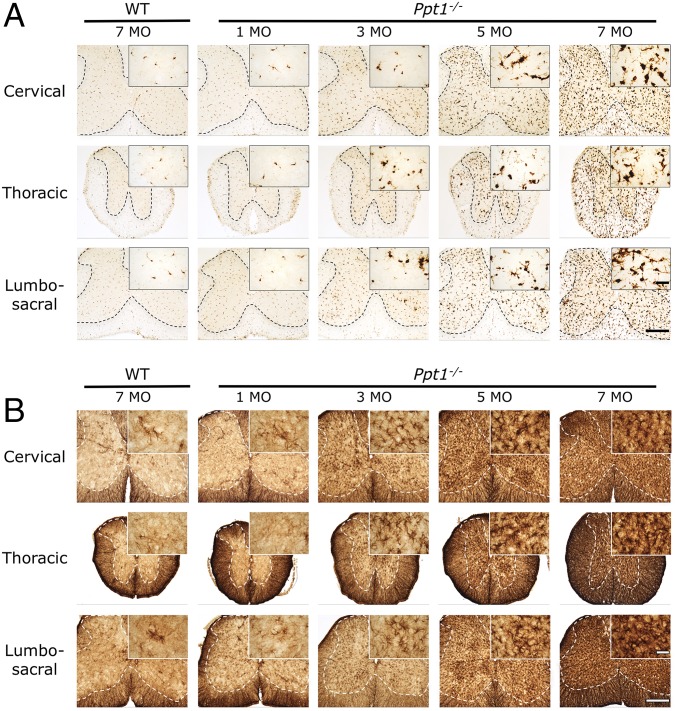
Fig. 2.
Ppt1−/− mouse spinal cord shows progressive glial activation at all levels. Representative bright-field microscopy images of the spinal cords of Ppt1−/− and wild-type control mice reveal the increased abundance, hypertrophy, and increased staining intensity of CD68-positive microglia (A) and GFAP-positive astrocytes (B) in mutant mice as early as 3 mo of age at all levels of the spinal cord. This glial activation progressively increases with age. The dotted lines demarcate the boundary between the gray and white matter. [Scale bars, 200 μm and 25 μm (Insets).] (Insets) Selected from corresponding lower-power views.

