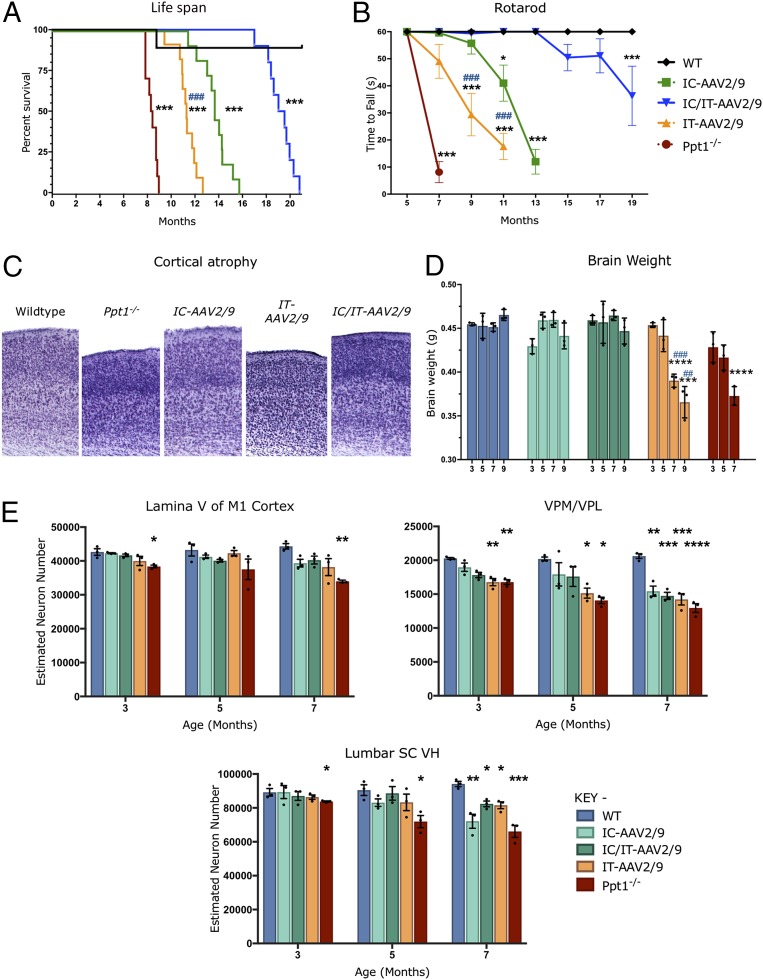
Fig. 4.
Targeted AAV2/9-mediated gene therapy delays disease progression and prevents neuron loss. (A) Kaplan–Meier survival curve showing that the median life span for combination IC/IT-treated mice (IC/IT-AAV2/9) (blue) is significantly greater than either intrathecally (IT-AAV2/9) (yellow) or intracranially (IC-AAV2/9) treated mice (green) (n = 10 mice per group). Analysis by log-rank test for trend was significant for overall survival (P < 0.0001). Individual comparisons between curves, using Bonferroni correction for multiple comparisons, were each significant (***P < 0.001) for each group compared with the wild type, as well as between intrathecally (IT-AAV2/9) and intracranially (IC-AAV2/9) treated mice (###P < 0.001). (B) Constant-speed rotarod test revealed that untreated Ppt1−/− mice (red) were unable to stay on the rotarod past 7 mo, intrathecally (IT-AAV2/9) treated mice (yellow) could not stay on the rotarod past 11 mo, intracranially (IC-AAV2/9) treated mice (green) could not stay on the rotarod past 13 mo, and combination IC/IT-treated mice (IC/IT-AAV2/9) (blue) showed deficits at 15 mo and could not stay on the rotarod past 19 mo. Statistical significance for each group compared with wild-type mice (*P < 0.05, ***P < 0.001), and compared between intrathecally (IT-AAV2/9) and intracranially (IC-AAV2/9) treated mice (###P < 0.001), two-way repeated-measure ANOVA (n = 10 mice per group). (C) Representative images of cortices from treated animals in Nissl (cresyl fast violet)-stained sections showing near–wild-type thickness of IC-AAV-2/9– and IC/IT-AAV2/9–treated mouse cortices but not in IT-AAV2/9–treated mice. (D) Brain weights for IC-AAV2/9– and IC/IT-AAV2/9–treated mice were essentially the same as WT mice at all time points examined. However, IT-AAV2/9–treated and untreated Ppt1−/− mice showed a significant reduction in brain weight compared with WT brain weight at 7 and 9 mo. Dots represent scatterplots of individual animals. Significance is compared with wild-type mice (***P < 0.001, ****P < 0.0001), and compared between intrathecally (IT-AAV2/9) and intracranially (IC-AAV2/9) treated mice (##P < 0.01, ###P < 0.001), two-way repeated-measure ANOVA (n = 3 mice per group). (E) Unbiased optical fractionator counts of Nissl (cresyl fast violet)-stained neurons at 3, 5, and 7 mo post injection in the M1 motor cortex, VPM/VPL of the thalamus, and ventral horn (VH) of the lumbar spinal cord show that targeted AAV-2/9–mediated gene therapy has a neuroprotective effect. Significance is compared with untreated WT mice at all time points. Dots represent scatterplots of individual animals. *P < 0.05, **P < 0.01, ***P < 0.001, ****P < 0.0001, one-way ANOVA with post hoc Bonferroni correction. Values shown are mean ± SEM (n = 3 mice per group).

