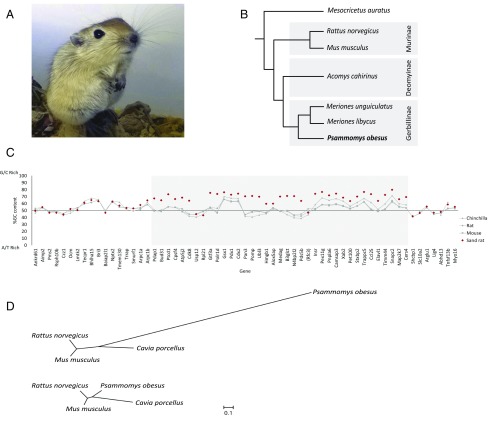
Fig. 1.
The sand rat and its genomic hotspot of mutation. (A) Juvenile sand rat P. obesus. (B) Cladogram of representative murid rodents indicating the phylogenetic position of sand rat. (C) GC content of genes around the ParaHox cluster of sand rat and other rodents (Mus musculus, Rattus norvegicus, Chinchilla lanigera) revealing a chromosomal hotspot of GC skew in sand rat (shaded in gray). Genes shown in inferred ancestral gene order; parentheses around Rfc3 indicate this gene has been transposed to a different genomic location in sand rat. Sand rat GC values based on transcriptome and genome sequences; when partial only alignable sequence is compared. (D) Unrooted phylogenetic trees inferred from synonymous changes (dS) only from concatenated alignments of 26 genes in the mutational hotspot (Upper) and 100 random genes (Lower).

