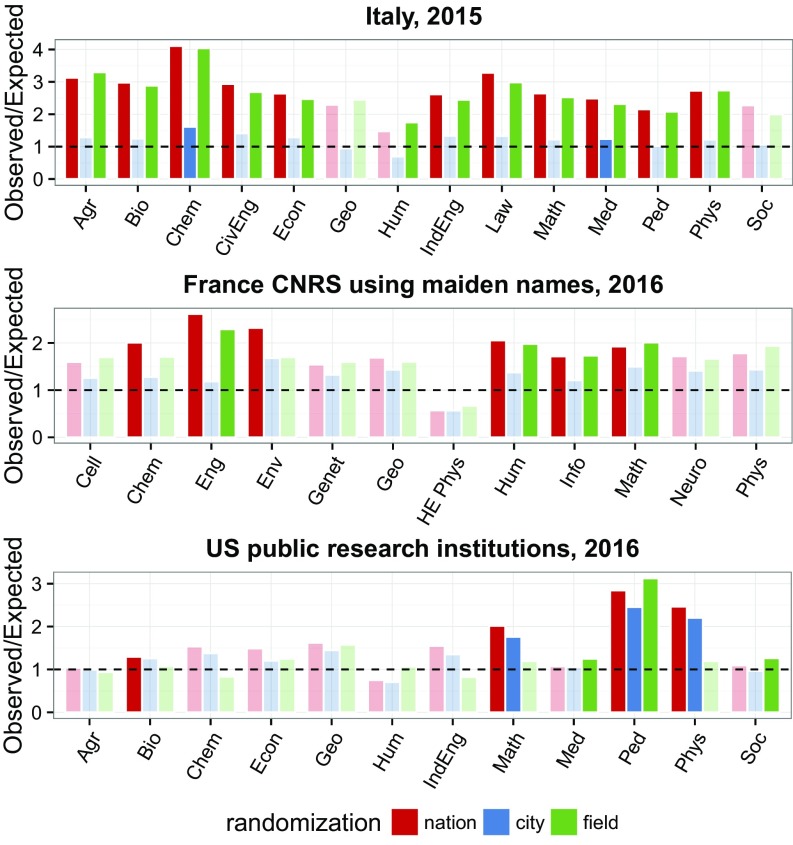
Fig. 1.
Ratio between observed and expected numbers of IPs for each academic system and field. Different colors stand for three randomizations explained in the text; saturated colors mark fields in which the probability of finding a higher or equal number of IPs by chance is (i.e., significant after applying a Bonferroni correction for multiple hypothesis testing). Agr, agriculture; Bio, biological sciences; Cell, cell and molecular biology; Chem, chemistry and pharmaceutical sciences; CivEng, civil engineering and architecture; Econ, economics and statistics; Eng, engineering; Env, environmental sciences; Genet, genetics; Geo, geology and Earth sciences; HE Phys, high-energy physics; Hum, philology, literature, archeology; IndEng, industrial, electronic, and electric engineering; Info, information and communications sciences; Law, law; Math, mathematics and computer science; Med, medical sciences; Neuro, neuroscience; Ped, pedagogy, psychology, history, philosophy; Phys, physics and astrophysics; Soc, social and political sciences.

