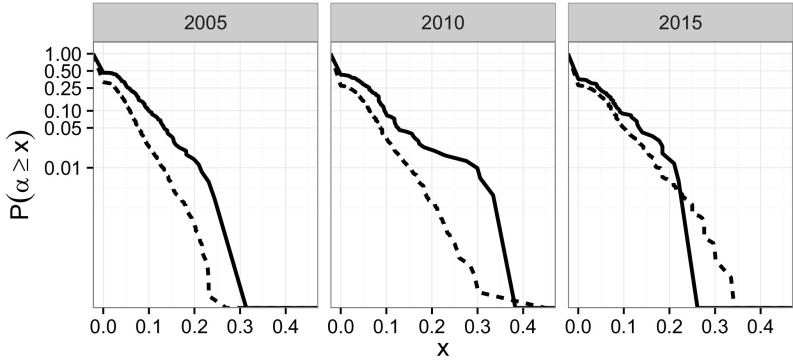
Fig. 6.
Cumulative distribution of the maximum likelihood estimates . For each department, is the maximum likelihood estimate of the probability of sampling new hires from the names already present in the department as opposed to the rest of the city. The solid lines show the distribution of the data, whereas the dashed lines are obtained repeatedly by randomizing the last names of all new hires in a 5-year period. For example, for the hires between 2000 and 2005, we find that 10% of the departments yield a , whereas in the randomizations, we find that only 2.4% of the departments should have such elevated values of .

