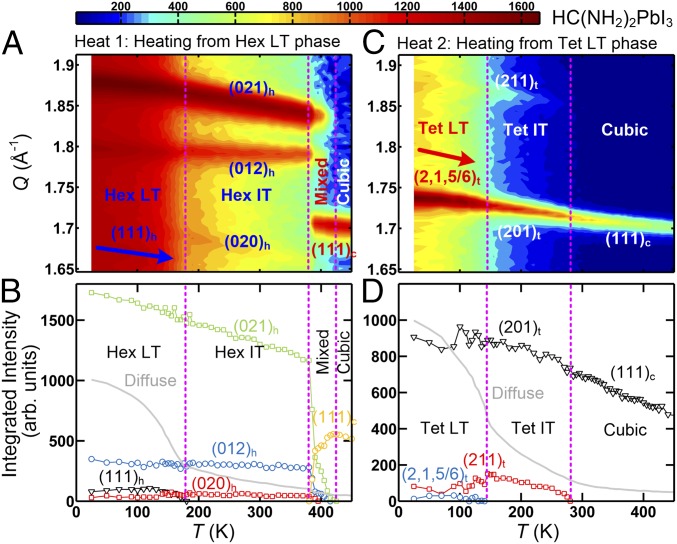
Fig. 3.
Structural transitions of HC(ND2)2PbI3. Elastic neutron scattering data obtained at the Spin-Polarized Inelastic Neutron Spectrometer, NIST Center for Neutron Research, for HEAT1 (A and B) and for HEAT2 (C and D) process. A and C are contour maps of the scattering intensity as a function of momentum transfer, Q, and temperature, T. Q range of 1.65 to 1.91 Å−1 was covered to probe the distinctive nuclear Bragg peaks; the (111)c peak associated with the cubic, (020)h, (012)h and (021)h with Hex IT and Hex IT, (111)h with Hex LT, (201)t and (211)t with Tet IT and Tet LT, and the (2,1,5/6)t superlattice peak associated with Tet LT. B and D show the integrated intensities of the Bragg peaks as function of T. The light-gray line indicates the temperature-dependent diffuse scattering intensity that is due to freezing of the rotational motion of the organic molecule (21). The vertical dotted lines represent the phase boundaries.

