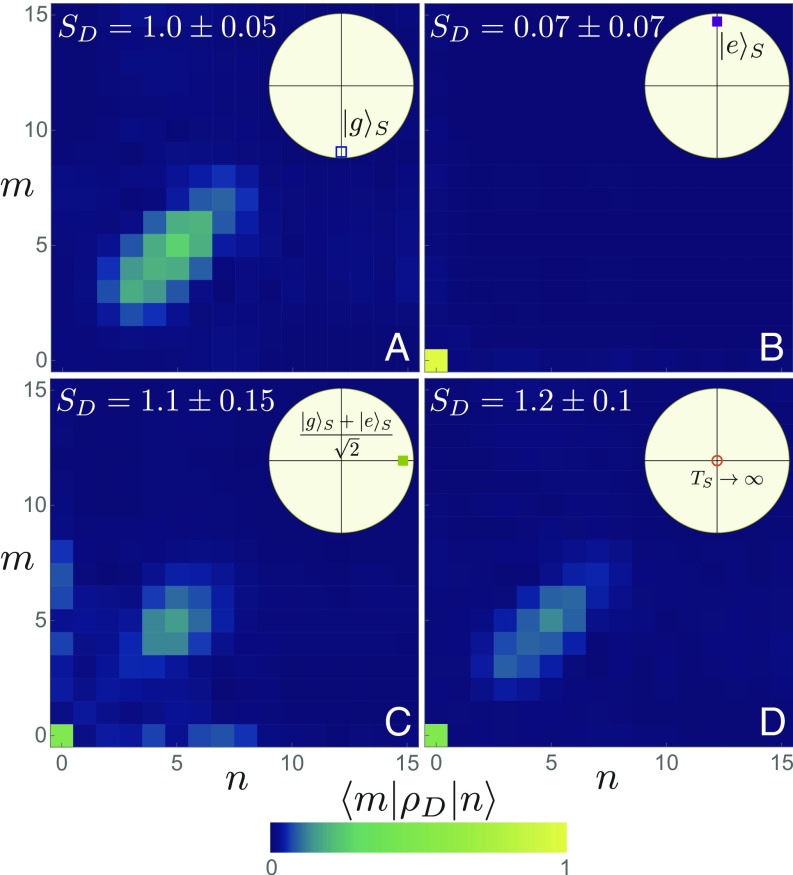
Fig. 4.
Tomography of the demon state. Reconstructed density matrix by maximum likelihood at the end of the work extraction step 4, for and when the system is initially (A) at temperature 0.10 K, (B) close to the excited state, (C) a superposition of ground and excited states, and (D) a maximally mixed state (see Bloch vector in Insets). Each pixel represents the amplitude of a density matrix element in the Fock basis, and the von Neumann entropies are given. (Wigner function is shown in SI Appendix.)

