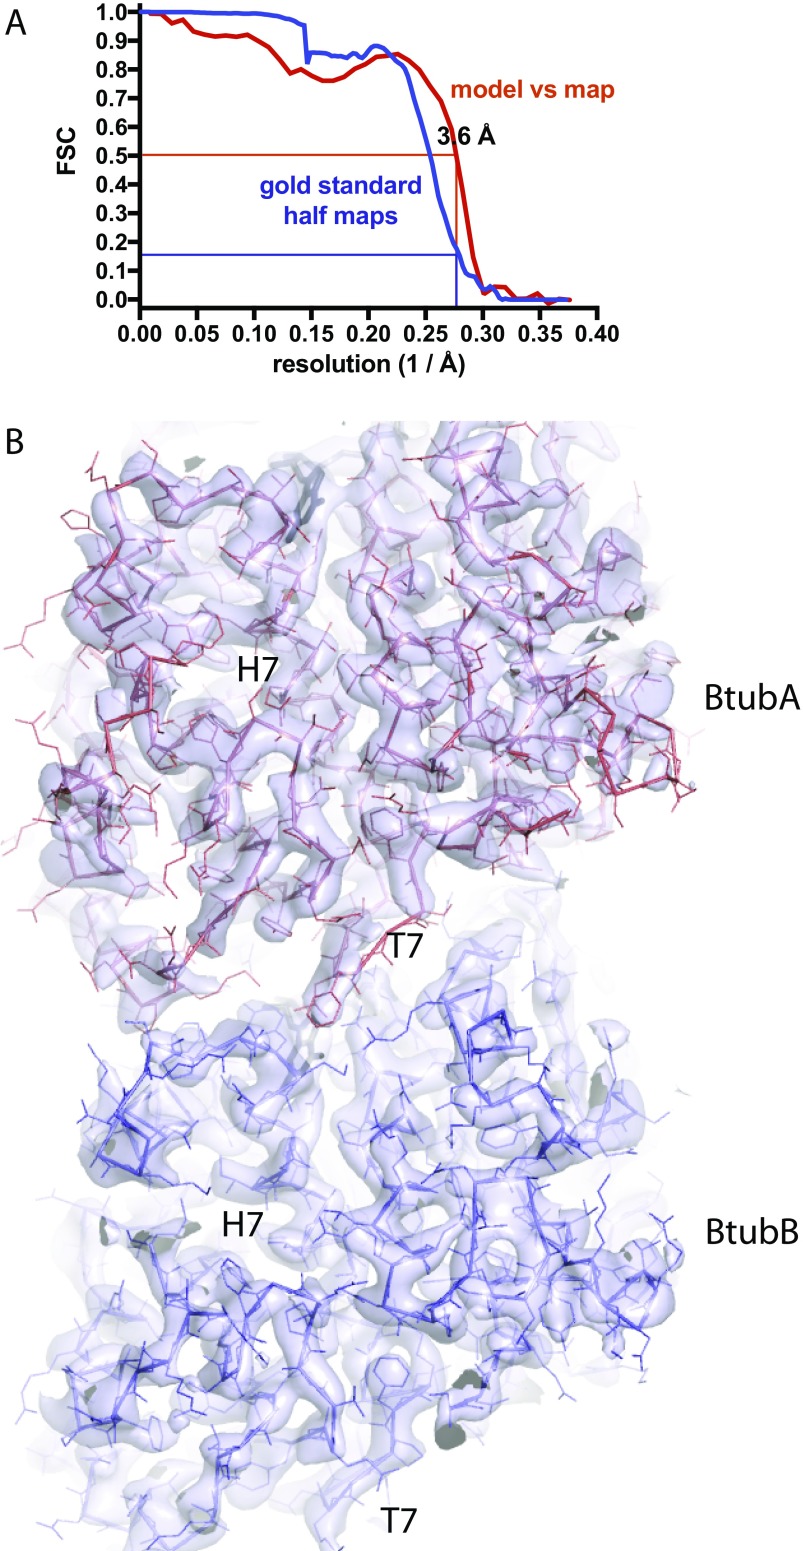
Fig. S3.
(A) BtubABC cryoEM Fourier shell correlation (FSC) of the half maps and atomic model. The blue curve describes the FSC as calculated by RELION during postprocessing, comparing the two gold standard half maps that have been kept separate for the entire procedure before they are combined. Filament segments were kept separate at the filament level to avoid overfitting through the inclusion of identical parts of the original images in the two half sets because filament segments overlap. A spherical mask was used for the determination of a sharpening B factor and half map FSC during postprocessing only, and covered one complete BtubAB heterodimer (but not BtubC, which had weaker density and was not refined). The mask was softened at the edges with an eight-pixel raised cosine edge. The red curve describes the FSC of a map generated from the one used to refined BtubAB heterodimer (omitting BtubC, both half maps averaged), cut around the atomic model, against the final atomic model. Using the suggested resolution estimates at FSC 0.5 for the model vs. map and FSC 0.143 for the two gold standard half maps, identical values of 3.6 Å were obtained. (B) PdBtubABC filament cryoEM density map at 3.6 Å resolution. Final map used for model building and refinement with the refined atomic models for BtubA (red) and BtubB (blue) superimposed. See also Movie S2.

