Fig. S6.
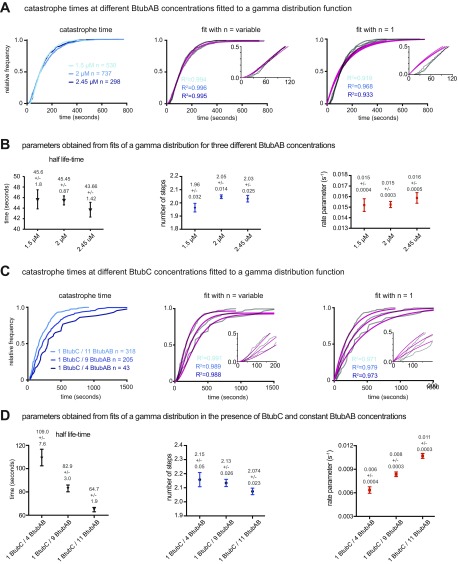
Analysis of BtubAB catastrophe times and gamma function fitting parameters obtained for different BtubAB and BtubC concentrations. Related to Fig. 3. (A) Cumulative distribution of catastrophe times fitted to a gamma function (Materials and Methods). A multistep process where n > 1 is compared with a single-step process (n = 1) obtained by fitting a gamma distribution describes catastrophe of BtubAB filaments best over a range of concentrations. The goodness of the fits for different n (magenta) is given as the mean R2 value for each condition (color coded) in the corresponding graph. (B) BtubAB concentrations have only small effects on mean lifetimes, number of steps and rate parameters that have to take place before catastrophe. Values are given above each data point, and error bars represent 95% confidence intervals. (C) Experimentally obtained distribution of catastrophe times for different ratios of BtubC to BtubAB, for which the concentration of BtubAB was kept constant at 2 µM. Catastrophe is still a multistep process with n = 2 steps as seen for BtubAB alone. Again, fits for different n (magenta) are evaluated by R2 values for each condition (color coded). (D) BtubC has an effect on BtubAB lifetimes. Increasing molecule ratios (BtubC to BtubAB) shifts the distribution to older filaments, by reducing the rate parameters at which the steps have to occur to induce a catastrophe. Values are again given above each data point, and error bars represent 95% confidence intervals.

