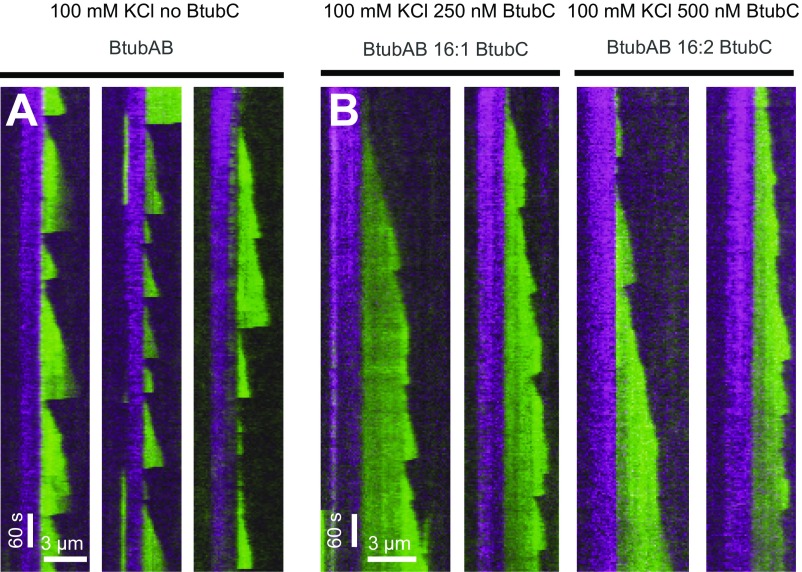
Fig. S8.
Strongly fluorescently labeled BtubAB dynamics and BtubC-dependent stabilization in 100 mM KCl. Dual-color kymographs of filaments emanating from stabilized seeds grown alone (A) and in the presence of BtubC (B). BtubAB concentration is the same as used for quantification and shown in Fig. 3. Here, BtubAB is labeled 1:3, and experiments were performed under different salt concentration (100 mM KCl). Still, stabilization occurs. Note that growth seems to be affected as indicated by the shorter extensions formed from seed compared with Fig. 3 and generally slower growth velocities. Images were acquired by using the same settings as described in Materials and Methods.

