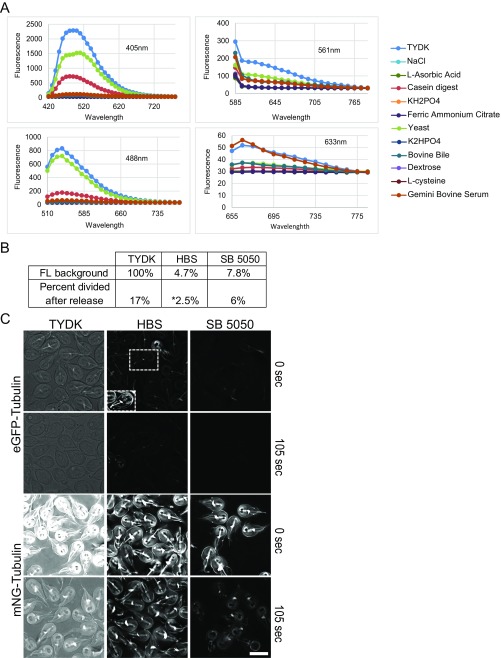
Fig. S1.
Development of low-fluorescence SB5050. (A) Spectral scan of TYDK components. The fluorescence from each TYDK component was analyzed over the typical spectra used in fluorescence microscopes. Note that autofluorescence decreases at higher wavelengths. Approximately 90% of the TYDK autofluorescence comes from N-Z Case and Yeast Extract (Dataset S1 includes tested formulations). (B) The table indicates fluorescence (FL) background normalized to TYDK (excitation, 475/28 nm; emission, 523/36 nm), the percentage of cells dividing within 1 h of being released from the microtubule inhibitor albendazole used to partially synchronize the cell cycle. (*All division in HBS occurred within 5 min of cells being transferred from TYDK + albendazole, which precludes the use of agarose overlay to inhibit cell motility.) Measurements are from three independent experiments. (C) SB5050 medium reduces autofluorescence and aids in time-lapse imaging. All images were acquired and scaled identically except for inset. TYDK background fluorescence is problematic, eGFP is unusable, and signal-to-noise quickly becomes an impediment as imaging bleaches out mNeonGreen. mNeonGreen is a superior fluorescent protein for imaging in Giardia as a result of fast fold times (less than 5 min) and higher intrinsic brightness. (Inset) eGFP-Tubulin scaled for optimal viewing to demonstrate that eGFP was given sufficient time to fold (40 min). (Scale bar: 10 µm.)

