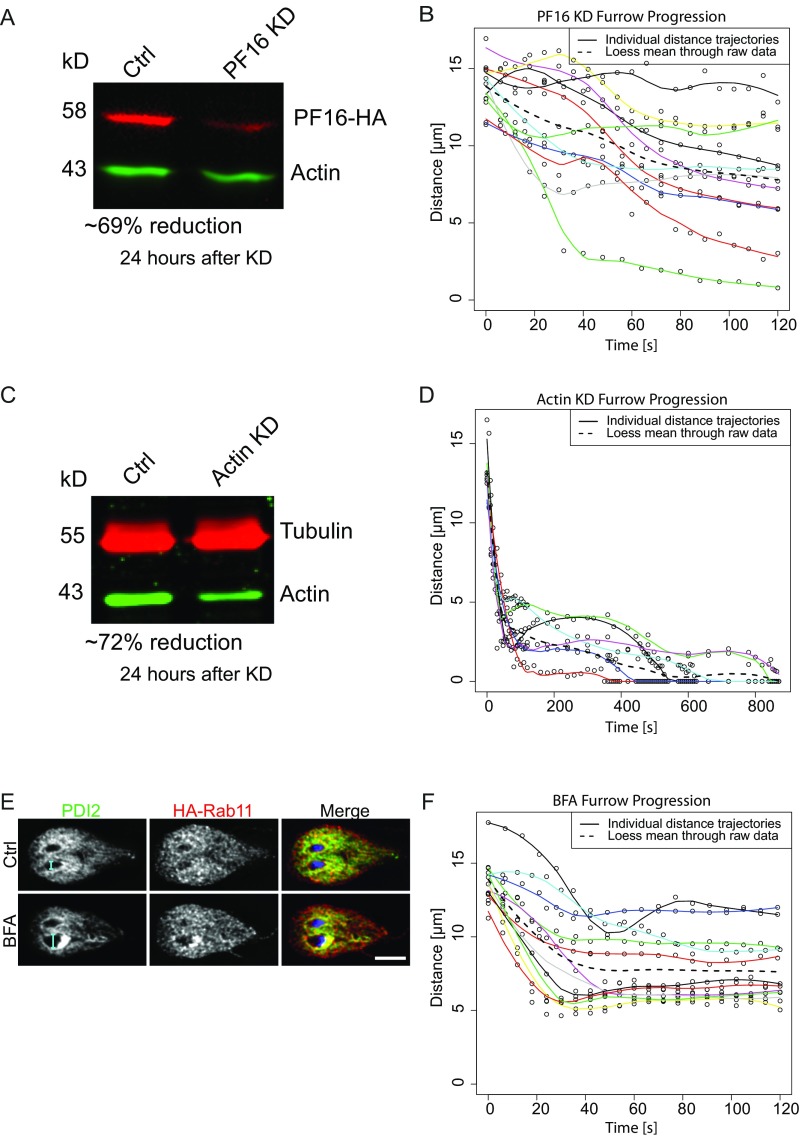
Fig. S3.
Individual trajectories from PF16-KD, Actin-KD, and BFA treatment. (A) Western blot showing ∼69% reduction in PF16 24 h after morpholino treatment. (B) Individual trajectories of PF16-KD cells. (C) Western blot showing ∼72% reduction of actin 24 h after morpholino treatment. (D) Individual trajectories of actin-KD cells. (E) PDI2 and HA-Rab11 localization 60 min after DMSO and BFA treatment. (Scale bar: 5 μm.) Note cyan dimension bars showing swelling after BFA treatment. (F) Individual trajectories of BFA-treated cells. Cells for analysis were selected from three independent experiments.

