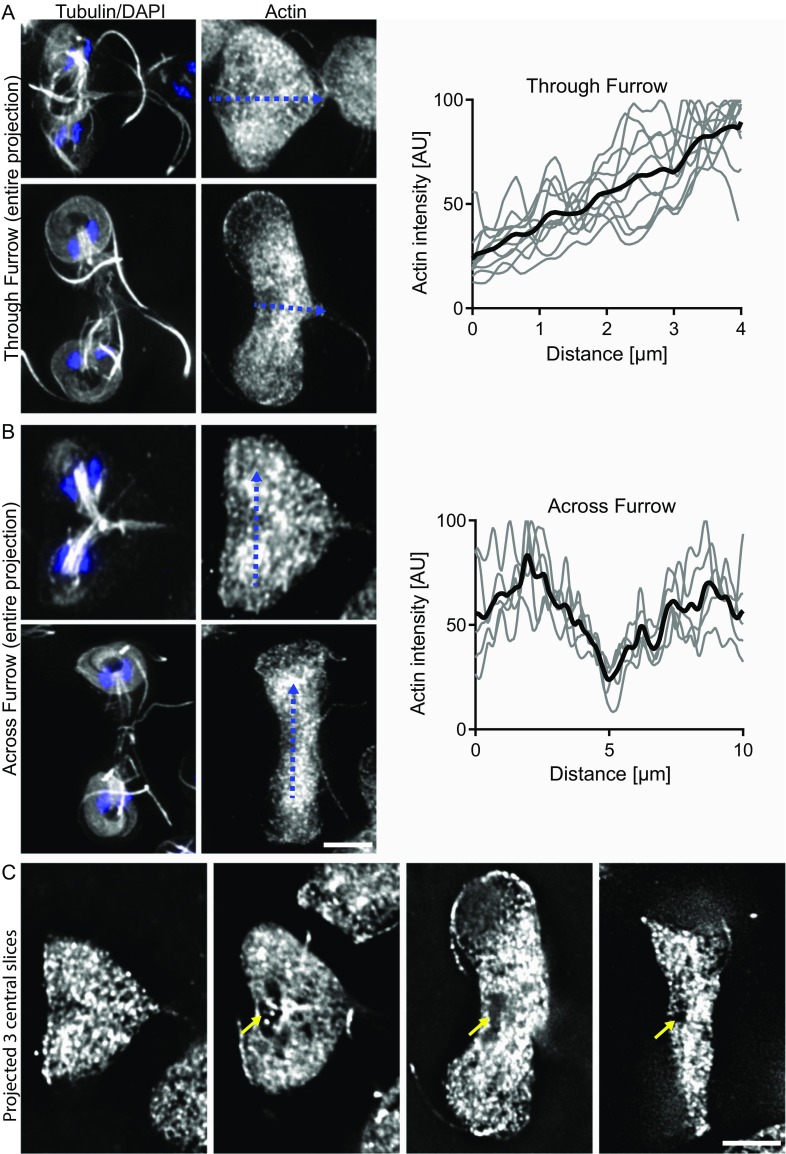
Fig. S5.
Actin is cleared ahead of the advancing furrow. (A) Average projections of cells early and midway through cytokinesis with plot of actin intensities along the furrow of 10 cells (black line is the mean). Note low levels in the first 1 µm of the furrow. (B) Average projections of cells early and late in cytokinesis with plot of actin levels across the furrow of five cells (black line represents the mean). Note that, in contrast to cells with a contractile ring, actin levels dip precisely at the midpoint of the cell. (C) Projected images of three central optical sections for cells at progressive stages of cytokinesis. Note that actin is cleared just ahead of the advancing furrow (yellow arrows). (Scale bars: 5 μm.)

