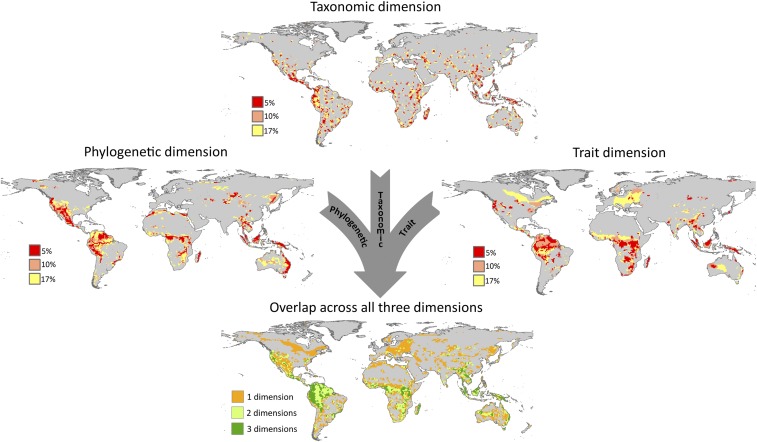
Fig. 1.
The top 17% of cells selected according to zonation prioritization based on the taxonomic dimension, phylogenetic dimension, trait dimension and on the overlap across the three dimensions. In the overlap map, cells in which all three dimensions overlap are shown in dark green, those in which two dimensions overlap are shown in light green, and those selected only by one dimension are shown in orange.

