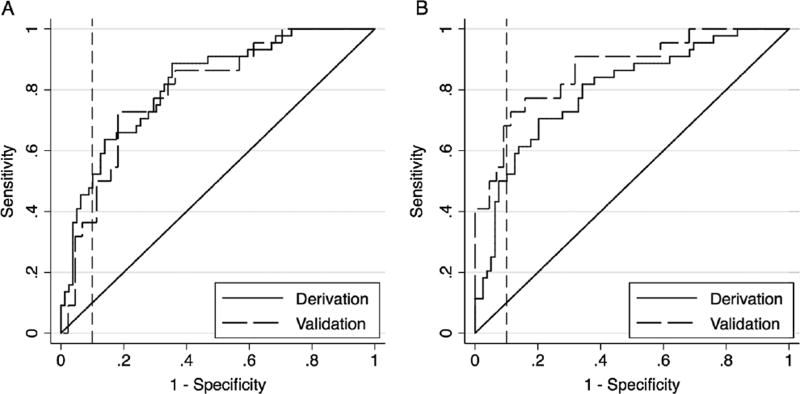
Figure 1.
Receiver operating characteristic curve for (A) the derivation and validation prediction models incorporating clinical, exposure and individual radiological variables and (B) the derivation and validation prediction models incorporating clinical, exposure and radiologist’s confidence variables. The solid and dashed lines represent the derivation and validation cohorts, respectively. The curve areas to the left of the vertical line indicate diagnostic specificity ≥90%.

