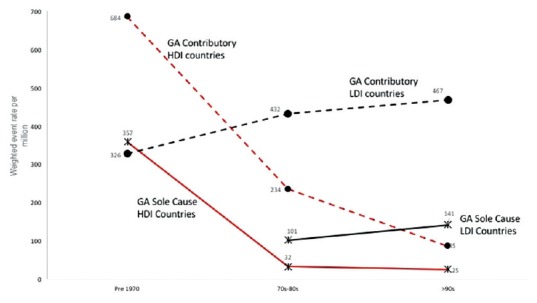
Figure 1.

Weighted event rate (death rate) per million against period. Solid lines: Death rate where anaesthesia was the sole cause of mortality; Dashed lines: Death rate when general anaesthesia. Contributed to perioperative mortality; Black lines: Low development index countries; Red lines: High development index countries; GA: General anaesthesia; HDI: High development index; LDI: Low development index
