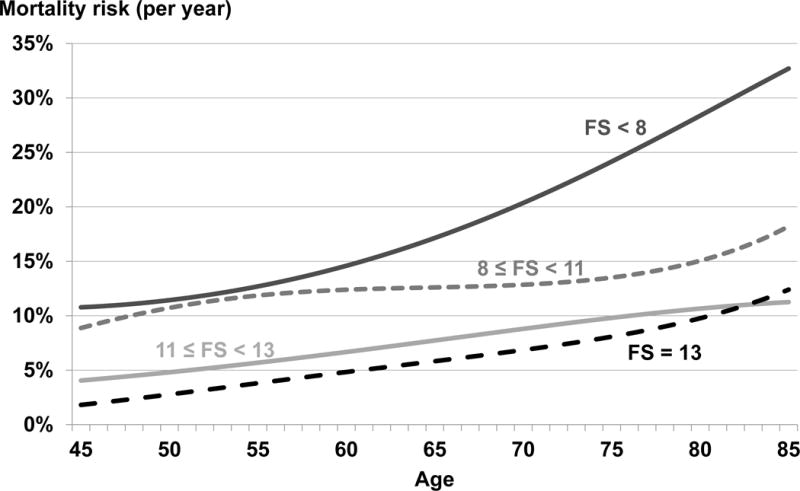
Figure 2. Mortality risk (per year) by age and functional status (FS).

Discrete survival model with binomial distribution, logit link function, and log(follow-up) offset. Model was adjusted for country and included age as a cubic term and an interaction between FS category and age. Predicted probabilities for age*FS combinations used to estimate mortality risk.
