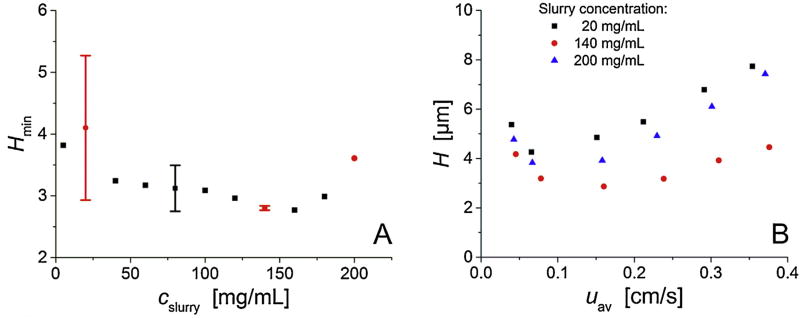
Fig. 2.
Column efficiency as a function of the slurry concentration (cslurry). (A) Plate height minima Hmin (extracted from the full plate height curves) vs. the slurry concentration cslurry for the entire set of sixteen capillary columns packed with 1.9 µm C18-modified BEH silica particles applying cslurry from 5 to 200 mg/mL. Data with error bars indicate packing reproducibility. Red circles denote the three slurry concentrations at which columns were selected for CLSM-based reconstruction and analysis of bed microstructure.(B) Plate height curves of the columns selected for reconstruction and morphological analysis: plate height for hydroquinone in 50/50 (v/v) water/acetonitrile mobile phase (k’ = 0.2) vs. the average mobile flow velocity. (For interpretation of the references to colour in this figure legend, the reader is referred to the web version of this article.)

