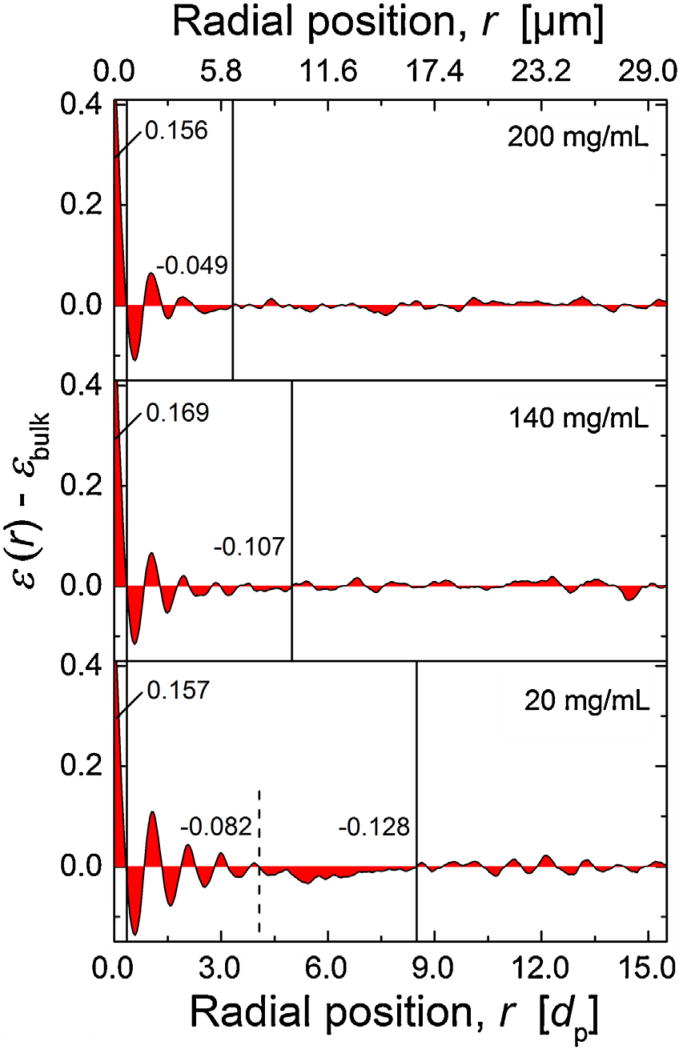
Fig. 5.
Radial distribution of the relative porosity ε(r) − εbulk(r = 0 at the column wall). Calculated integral porosity deviation (IPD) values (cf. Eq. (3)) for different regions are provided as numbers, vertical lines visualize associated integration limits. Regions from left to right: gap between hard column wall and first layer of particles; particle layers near the wall with decreasing order towards center of the column; transition region in the 20 mg/mL column with higher-than-average packing density; bulk region. The values of εbulk are given in Table 1.

