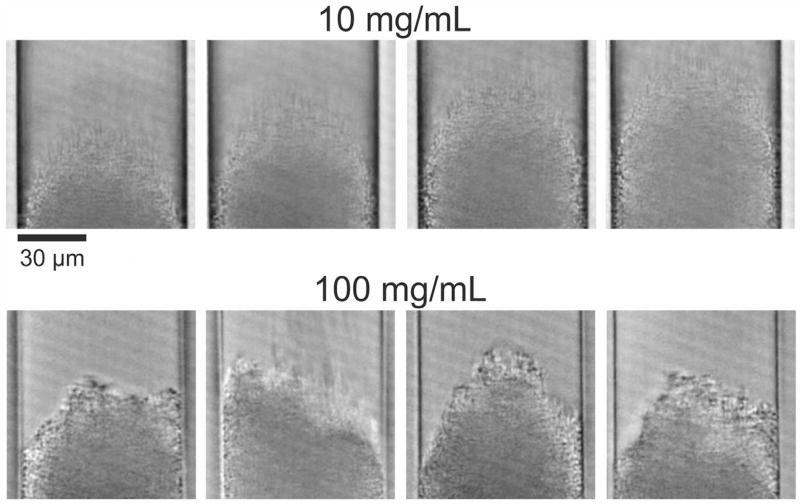
Fig. 9.
Exemplary frames from the videos taken during the formation of the column beds for slurry concentrations of 10 and 100 mg/mL. At the lower slurry concentration (top row), the bed is formed by a stream of individually arriving particles resulting in a cone-like shape of the bed front. At the higher slurry concentration (bottom row), particles arrive in large patches causing fluctuations in the shape of the actual bed front.

