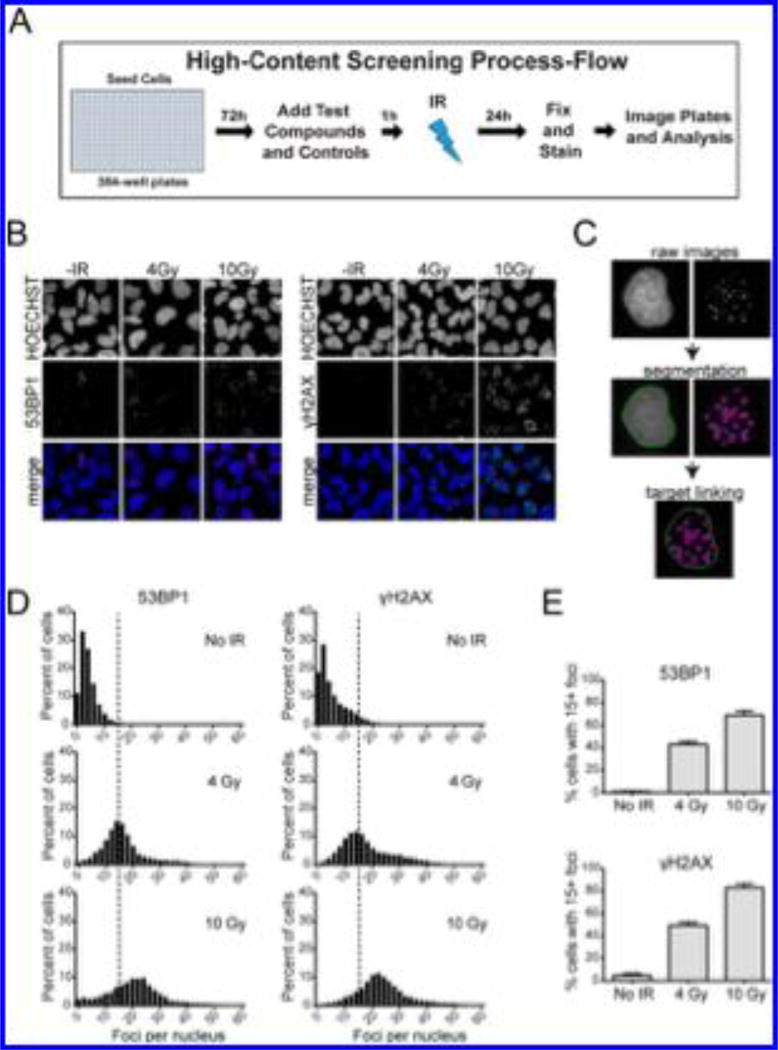
Figure 1.
Development of the high-throughput primary assay for quantification of 53BP1 and γH2AX foci in U2OS cells. (A) Schematic depicting the workflow of the assay. (B) InCell 2200 images of 53BP1 and γH2AX foci in cells exposed to 4 or 10 Gy IR and analyzed 5 h postirradiation. HOECHST dye was used to stain nuclei. (C) Example of segmentation and linking of nuclei and foci using image analysis algorithm developed using the InCell Analyzer software. (D) Distribution of cell population as a function of 53BP1 and γH2AX foci number. Histograms for control cells (no IR) and cells subjected to 4 or 10 Gy IR, and analyzed 5 h postirradiation are shown. Dashed line represents 15 foci threshold described in the main text. (E) Percent of cells with ≥15 53BP1 or γH2AX foci after treatment with 4 or 10 Gy IR.

