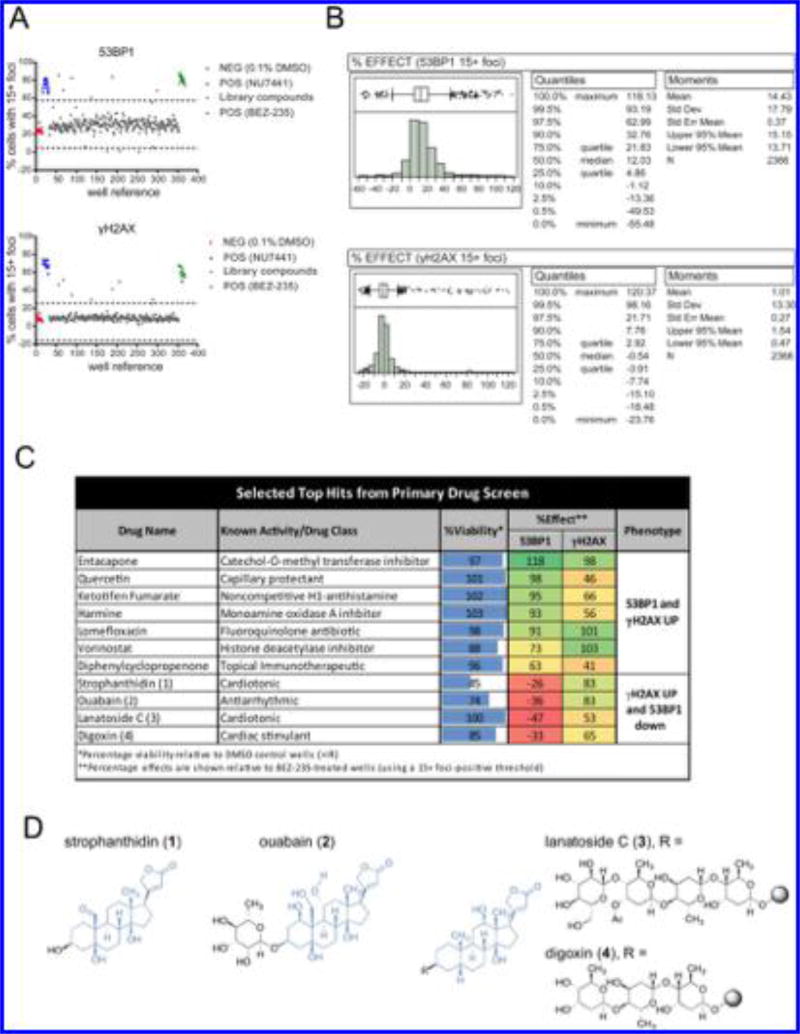
Figure 3.
Results of a screen of 2366 bioactive compounds. (A) Scatter plots of raw data (percentages of cells with ≥15 53BP1 or γH2AX foci) from a representative screening plate. Blue and green data points correspond to wells treated with 5 µM NU7441 or 1 µM BEZ-235, respectively. Gray data points represent the screening population, and red points represent vehicle (negative control). (B) Histograms of normalized data (percent effect relative to 1 µM BEZ-235) for the entire screening population. Quantiles and moments for all of the tested compounds (n = 2366) are shown on the right. (C) Table of selected top hits satisfying the 3 standard deviation cutoff. Normalized viabilities and effects on 53BP1 or γH2AX foci observed in the primary screen are shown. (D) Chemical structures of cardiac glycosides 1–4.

