Figure 4.
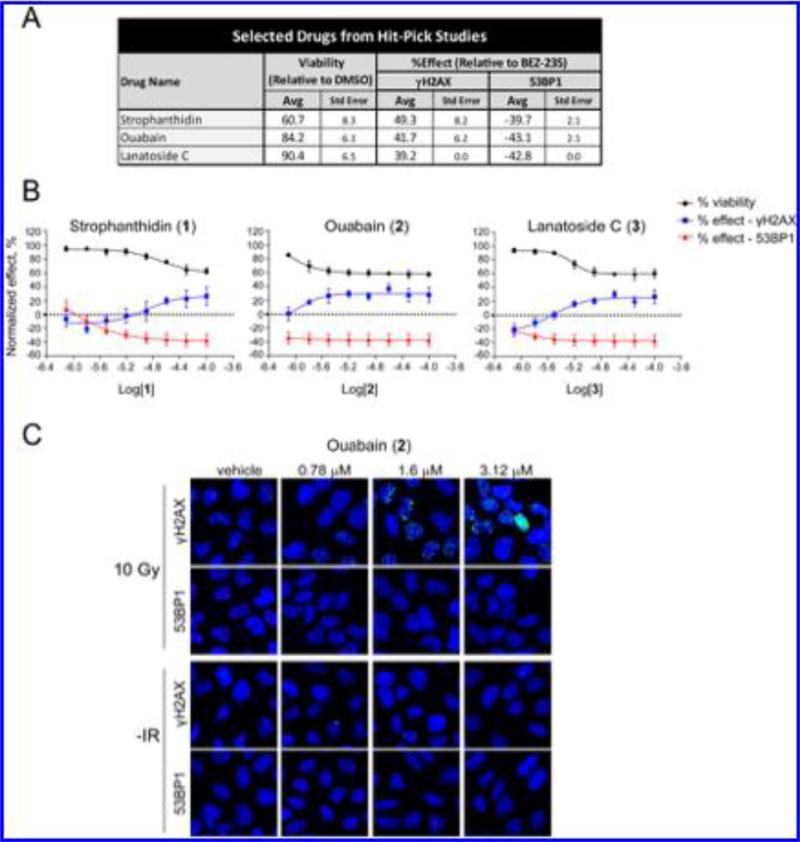
Hitpick and dose–response analysis of selected screen actives. (A) Hitpick table showing average and standard error values from DNA damage foci assays performed in quadruplicate for 1–3. The percent effect values shown are relative to BEZ-235-treated wells, as described in Materials and Methods. (B) Dose-dependent effects of 1–3 on cell viability and 53BP1 or γH2AX foci numbers in U2OS cells subjected to 10 Gy IR. Cells were pretreated with 1–3 for 1 h, irradiated, and then analyzed 24 h postirradiation. Percent viability relative to DMSO control wells and normalized foci effects relative to BEZ-235-treated wells are shown. The X axis is the logarithm of the molar concentration of 1, 2, or 3. (C) 53BP1 and γH2AX foci images of cells 24 h postirradiation after treatment with 2.

