
Fig. 7.
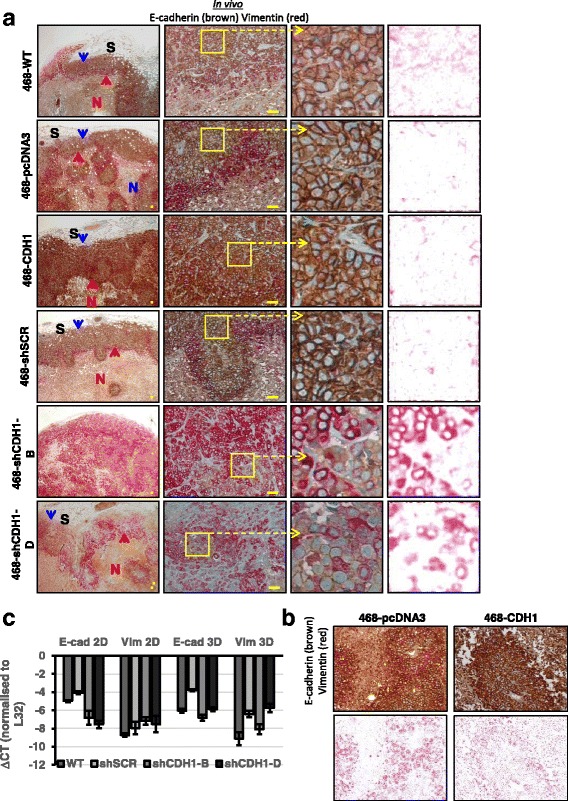
a Epithelial-mesenchymal plasticity status in vivo as xenografts in mice. E-cadherin was assessed by double-immunohistochemistry (IHC) of E-cadherin (brown) and vimentin (red). Vimentin-positive cells at tumor-stroma interface are indicated by blue arrowheads, and at tumor-necrosis border they are indicated by red arrowheads. Red-channel images are shown for vimentin IHC clarity. All scale bars = 50 μm. b Enlargement of 468-pcDNA3 and 468-CDH1 tumors showing differences in vimentin-E-cadherin staining. c Quantitative polymerase chain reaction expression of the same modified cells grown in 2D versus 3D. ΔCT Cycle threshold change, SCR Scrambled, WT Wild type