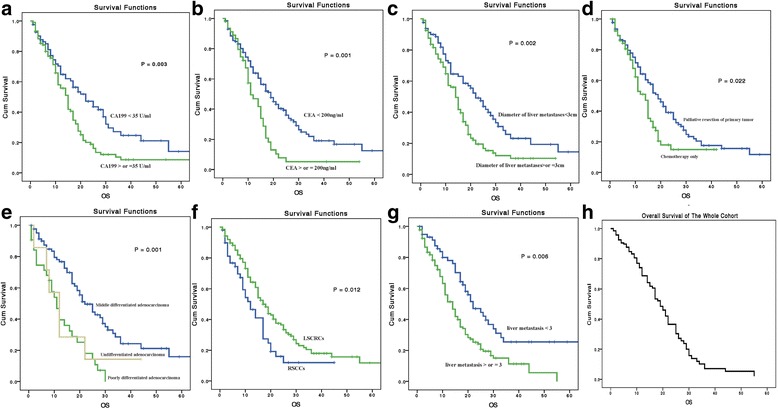
Fig. 2.

Kaplan–Meier curves for 5-year overall survival (OS) in different prognostic subgroups. a OS in different CA199 level groups. b OS in different CEA groups. c OS in different liver metastasis diameter groups. d OS in palliative resection and chemotherapy only groups. e OS in different histology groups. f OS in different primary tumor location groups. g OS in different number of liver metastasis groups. h Cox hazards regression analysis for 5-year OS in the entire cohort
